By Otto Acosta, Offerpad Research Team
Every spring, the same question surfaces in real estate conversations across the country: When is the best time to sell a house?
The answer costs real money to get wrong. Across 16 major U.S. markets, homes that closed in June sold for a median of $388,791, while homes that closed in January sold for $361,497. That is a $27,294 gap for the same types of houses, in the same cities, separated only by the calendar.
But the best month to sell a house depends on what matters most to you. If you want the highest price, aim for June. If you want the fastest sale, July is your month. If you want the most competitive offer environment, where buyers bid above asking price, May is the sweet spot. And if you happen to live in Phoenix or Tampa, none of this matters nearly as much as it does in Indianapolis or Saint Louis.
Offerpad analyzed more than 2.1 million single-family home transactions from January 2023 through March 2026 to quantify exactly how much timing matters, and where it matters most.

Best Month to Sell a House: Price, Speed, and Competition
The best time to sell a house depends on your priority. The table below shows the optimal and worst months for each selling metric, averaged across all 16 markets.
| Seller Priority | Best Month | National Average | Worst Month | National Average |
|---|---|---|---|---|
| Highest sale price | June | $388,791 median | January | $361,497 median |
| Fastest sale (days on market) | July | 44.0 days | February | 62.1 days |
| Most above-list sales | May | 23.6% | January | 12.4% |
| Smallest price reductions | May | $11,373 avg. | January | $16,948 avg. |
| Lowest seller concessions | October | $2,714 avg. | December | $3,110 avg. |
| Highest transaction volume | May | 4,320 avg./market | January | 2,418 avg./market |
The peaks do not line up because of the lag between listing and closing. Homes listed in April and May get showings, receive offers, and enter escrow over the following weeks. The spring listing rush creates summer closing peaks. The price peak in June reflects offers made during peak competition. The speed peak in July reflects sellers who listed into the hottest market of the year and moved through closing quickly.
The worst month to sell a house is January by nearly every measure: lowest prices, fewest buyers, and the largest average price reductions ($16,948).
When to Sell a House: Month-by-Month Breakdown
The table below shows how every major selling metric shifts across the calendar year, averaged across all 16 markets and all available years.
| Month | Days on Market | Median Sale Price | % Sold Above List | Avg. Price Reduction | Avg. Seller Concessions |
|---|---|---|---|---|---|
| January | 60.4 | $361,497 | 12.4% | $16,948 | $2,991 |
| February | 62.1 | $366,694 | 14.8% | $14,833 | $3,077 |
| March | 59.2 | $374,888 | 17.7% | $13,343 | $3,027 |
| April | 49.7 | $377,228 | 21.8% | $11,903 | $2,773 |
| May | 46.2 | $383,983 | 23.6% | $11,373 | $2,789 |
| June | 44.6 | $388,791 | 23.5% | $11,376 | $2,745 |
| July | 44.0 | $384,698 | 21.9% | $12,307 | $2,733 |
| August | 45.9 | $380,880 | 19.3% | $14,026 | $2,728 |
| September | 48.9 | $376,450 | 17.4% | $14,376 | $2,798 |
| October | 50.5 | $376,965 | 16.3% | $14,565 | $2,714 |
| November | 52.9 | $374,356 | 15.1% | $15,190 | $2,978 |
| December | 57.2 | $374,920 | 13.3% | $16,325 | $3,110 |
Source: Offerpad analysis of MLS data, Jan. 2023 – Mar. 2026, 16 metro areas, 2.1M+ transactions.
January and February are the trough. Homes sit longest, sell for the least, and face the weakest buyer competition. Sellers listing in winter often have reasons that override timing: a job relocation, a family change, or a financial deadline.
The spring acceleration is sudden. Between February and April, days on market drops by more than 12 days. Above-list sales jump from 14.8% to 21.8%. Buyers who spent winter browsing start putting in offers once inventory improves.
The best time to sell a house is the April-through-July window. These four months have the fastest sales, highest prices, most bidding wars, and smallest price reductions. Within that stretch, May and June are the dual peaks: May has the most competitive offers (23.6% above list) while June has the highest median price ($388,791). July is the speed peak, with homes selling in 44.0 days on average, 18 days faster than February.
Then the fade begins. By September, DOM has crept back above 48 days and above-list sales have dropped below 20%. Families settle into school-year routines and buyer urgency fades.
October has one quiet distinction: the lowest seller concessions of any month ($2,714). Buyers still searching by October tend to be committed, not browsing.
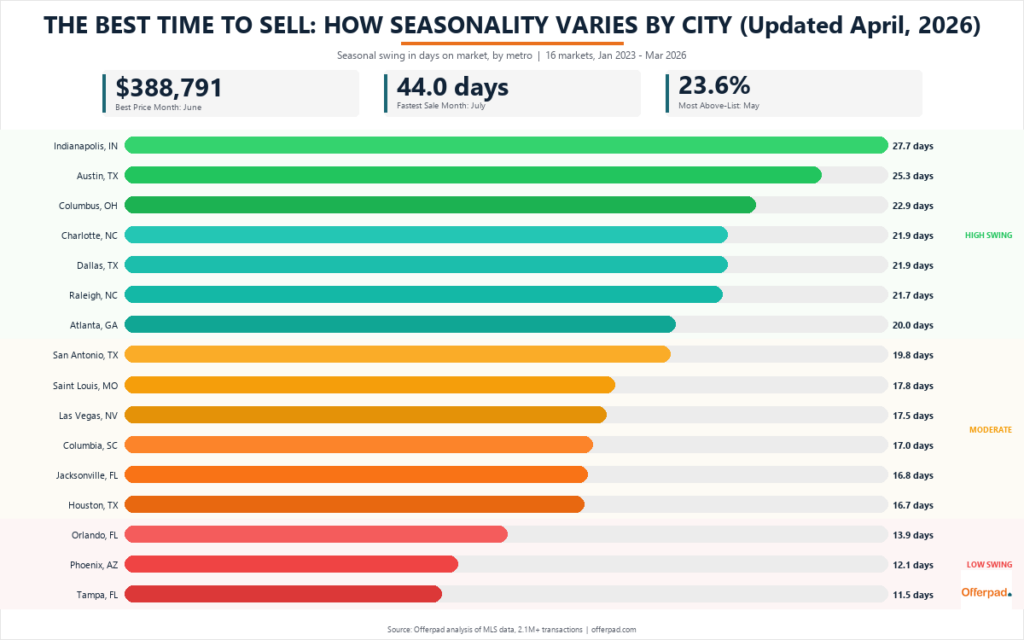
Best Time to Sell a House by City: Where Seasonality Hits Hardest
The national averages mask wide differences between cities. The seasonal swing in days on market ranges from 27.7 days in Indianapolis to 11.5 days in Tampa. Markets with cold winters tend to see the biggest seasonal swings, while Sun Belt cities with year-round warm weather show more consistent activity.
Days-on-Market Swing by Market
| Rank | Market | DOM Swing | Fastest Month | Slowest Month |
|---|---|---|---|---|
| 1 | Indianapolis | 27.7 days | June (25.5d) | February (53.2d) |
| 2 | Austin | 25.3 days | July (60.5d) | February (85.8d) |
| 3 | Columbus | 22.9 days | July (26.9d) | November (49.8d) |
| 4 | Charlotte | 21.9 days | June (35.7d) | February (57.6d) |
| 5 | Dallas | 21.9 days | June (44.5d) | February (66.3d) |
| 6 | Raleigh | 21.7 days | June (40.2d) | February (62.0d) |
| 7 | Atlanta | 20.0 days | June (34.3d) | January (54.4d) |
| 8 | San Antonio | 19.8 days | July (66.6d) | February (86.4d) |
| 9 | Saint Louis | 17.8 days | July (29.2d) | February (47.0d) |
| 10 | Las Vegas | 17.5 days | August (36.2d) | January (53.7d) |
| 11 | Columbia, SC | 17.0 days | August (37.2d) | March (54.2d) |
| 12 | Jacksonville | 16.8 days | July (59.0d) | February (75.8d) |
| 13 | Houston | 16.7 days | July (43.4d) | February (60.1d) |
| 14 | Orlando | 13.9 days | July (52.4d) | February (66.3d) |
| 15 | Phoenix | 12.1 days | July (52.7d) | February (64.8d) |
| 16 | Tampa | 11.5 days | July (52.8d) | March (64.3d) |
Three tiers emerge from the data:
High-swing markets (20+ days): Indianapolis, Austin, Columbus, Charlotte, Dallas, Raleigh, and Atlanta. These seven cities see the biggest seasonal shifts. Most are in the Midwest and Southeast, where cold winters and spring thaws create a distinct selling season. Sellers in these markets gain the most by timing their listing for spring and summer.
Austin is the puzzle in this group. It does not get cold enough to freeze buyers out, yet it shows the second-highest DOM swing in the dataset (25.3 days). The explanation likely lies in its economy rather than its weather. Austin’s tech sector runs on corporate hiring cycles that concentrate relocations in spring and early summer. When the big employers bring in new hires, demand surges. When hiring slows, the market cools.
Moderate-swing markets (15-20 days): San Antonio, Saint Louis, Las Vegas, Columbia, Jacksonville, and Houston. These cities show real seasonal variation but not enough to override other selling decisions. For sellers exploring their options in Houston or those considering a sale in Las Vegas, timing helps but is not the primary factor.
Low-swing markets (under 15 days): Orlando, Phoenix, and Tampa. Year-round migration from northern states, retiree relocations, and steady warm weather create more consistent demand. In Tampa, the difference between the best and worst months is 11.5 days, compared with 27.7 days in Indianapolis. For sellers in Phoenix or Orlando, home condition and pricing strategy likely matter more than which month they list.
A related Offerpad analysis of how long it takes to sell a house found similar patterns in these same markets, with Florida metros consistently showing less seasonal variation in time to sale.
Home Sale Prices by Season: What Timing Costs or Saves
Speed is one dimension. Dollars are another. Some markets see median prices shift by nearly 20% between peak and off-peak months. Others barely move.
| Rank | Market | Price Swing (%) | Price Swing ($) | Peak Month | Trough Month |
|---|---|---|---|---|---|
| 1 | Saint Louis | 19.2% | $47,792 | June ($296,667) | January ($248,875) |
| 2 | Columbus | 13.0% | $42,346 | June ($368,033) | January ($325,688) |
| 3 | Atlanta | 12.3% | $48,438 | June ($441,500) | January ($393,062) |
| 4 | Indianapolis | 9.9% | $28,365 | June ($314,615) | January ($286,250) |
| 5 | Raleigh | 8.2% | $31,860 | July ($418,333) | January ($386,474) |
| 6 | Dallas | 8.1% | $31,825 | June ($423,300) | January ($391,475) |
| 7 | Charlotte | 8.0% | $28,496 | June ($385,333) | January ($356,838) |
| 8 | San Antonio | 7.6% | $22,803 | June ($323,132) | February ($300,329) |
| 9 | Austin | 7.5% | $30,573 | June ($436,018) | January ($405,444) |
| 10 | Houston | 7.2% | $23,692 | June ($351,667) | January ($327,975) |
| 11 | Columbia, SC | 7.0% | $19,193 | June ($293,238) | January ($274,045) |
| 12 | Jacksonville | 6.5% | $24,484 | December ($400,749) | January ($376,265) |
| 13 | Tampa | 5.2% | $20,365 | June ($412,663) | January ($392,299) |
| 14 | Orlando | 4.1% | $16,213 | June ($407,017) | January ($390,804) |
| 15 | Las Vegas | 4.0% | $18,423 | July ($476,667) | January ($458,244) |
| 16 | Phoenix | 2.3% | $10,817 | May ($478,314) | January ($467,498) |
Saint Louis is the most extreme case. The median home there sells for 19.2% more in June than in January. For a home priced around $250,000, that is the difference between $249,000 and $297,000. Same house, same neighborhood, same school district. The only variable is the month.
Atlanta has the largest dollar swing ($48,438) because its higher median price amplifies even a moderate 12.3% seasonal shift. Columbus, with a lower median price, still shows a $42,346 swing because its 13.0% seasonal effect is among the strongest in the dataset.
At the bottom of the table, Phoenix barely moves. A 2.3% price swing ($10,817) means sellers face almost no price penalty for selling at the “wrong” time. For Phoenix sellers, the best time to sell is whenever the home is ready.
Jacksonville has an unusual pattern: its peak price month is December, not June. Northeast Florida draws winter buyers from the Northeast who decide over the holidays to make the move, pushing late-year demand and December prices above the summer months.
For sellers in Charlotte, Raleigh, or Atlanta weighing their options, the 8-12% price swing between peak and trough months could mean $28,000 to $48,000.
Bidding Wars by Month: When Homes Sell Above Asking Price
The percentage of homes selling above list price is one of the clearest indicators of buyer competition. Across all 16 markets, May leads at 23.6%, nearly double January’s 12.4%. The market-level variation is where the data gets more interesting.
| Market | Trough | Peak | Seasonal Swing |
|---|---|---|---|
| Columbus | Jan: 20.4% | May: 46.4% | 26.0 pp |
| Saint Louis | Jan: 25.5% | Jun: 50.3% | 24.9 pp |
| Indianapolis | Jan: 10.3% | May: 26.5% | 16.2 pp |
| Raleigh | Jan: 14.7% | Jun: 30.3% | 15.7 pp |
| Atlanta | Jan: 14.6% | May: 29.6% | 15.0 pp |
| Charlotte | Jan: 14.8% | May: 28.3% | 13.6 pp |
| Dallas | Jan: 10.0% | May: 22.3% | 12.3 pp |
| Las Vegas | Jan: 12.9% | Jun: 22.6% | 9.7 pp |
| Columbia, SC | Jan: 14.4% | May: 23.7% | 9.3 pp |
| Houston | Jan: 8.5% | May: 16.5% | 7.9 pp |
| Austin | Jan: 6.8% | Apr: 14.7% | 7.8 pp |
| Phoenix | Jan: 10.7% | Jun: 17.2% | 6.5 pp |
| Jacksonville | Jan: 8.4% | Jun: 14.2% | 5.8 pp |
| San Antonio | Dec: 8.3% | Jun: 13.2% | 5.0 pp |
| Orlando | Jan: 8.7% | Jun: 13.2% | 4.5 pp |
| Tampa | Jan: 8.8% | Jun: 13.3% | 4.5 pp |
Columbus and Saint Louis are the bidding war leaders. In Columbus, nearly half of all May transactions (46.4%) close above asking price. In Saint Louis, that figure passes 50% in June, meaning more buyers pay above list than below it. Both are affordable Midwestern markets where spring demand meets limited inventory, and the result is intense competition.
At the other end, Tampa and Orlando both show just 4.5 percentage points of seasonal swing in above-list sales. In these markets, the odds of a bidding war stay between roughly 9% and 13% year-round. For sellers evaluating their options in Tampa, timing is unlikely to change the competitive dynamics.
The same Offerpad analysis of how long it takes to sell a house found that markets with the biggest DOM swings also tend to have the largest bidding war swings, confirming that the same seasonal forces drive both speed and competition.
What This Means for Sellers in 2026
The data does not prescribe a single best strategy. It provides a framework for understanding the seasonal forces at play in each market.
In high-swing markets, timing is worth tens of thousands of dollars. Sellers in Indianapolis, Saint Louis, Columbus, and Atlanta can see $28,000 to $48,000 in median price differences between the best and worst months. Listing in April or May to target a June or July close gives sellers the combined advantage of higher prices, faster sales, and more competitive offers.
In low-swing markets, other factors matter more. Phoenix, Tampa, and Orlando show minimal seasonal variation. For sellers in these cities, home condition, pricing accuracy, and local neighborhood dynamics will likely determine the outcome more than which month they list.
Speed and price do not peak in the same month. The fastest sales happen in July (44.0 days) while the highest prices come in June ($388,791). Sellers prioritizing speed may benefit from listing slightly later in the spring.
January and February are the toughest months to sell by nearly every measure. Prices, speed, and buyer competition are all at their annual lows. Sellers who can avoid listing during these months will, on average, face better market conditions.
Peak months bring peak competition from other sellers. May has the highest transaction volume (4,320 average per market), meaning more new listings compete for buyer attention. A well-priced, well-presented home listed in April, slightly ahead of the rush, may outperform a weaker listing in May simply because it faces less inventory competition.
Methodology
This analysis is based on aggregated multiple listing service data for single-family home transactions from January 2023 through March 2026 across 16 metropolitan markets where Offerpad operates: Atlanta, Austin, Charlotte, Columbia (SC), Columbus (OH), Dallas, Houston, Indianapolis, Jacksonville, Las Vegas, Orlando, Phoenix, Raleigh, Saint Louis, San Antonio, and Tampa.
All statistics represent market-wide transaction data, not Offerpad-specific transactions. Seasonal averages are computed across all available years for each month. Days on market (DOM) measures the time from listing to contract. Median close price is the midpoint of all sale prices in a given month. Percent above list measures the share of transactions where the final sale price exceeded the original list price. Average price drop measures the average difference between original list price and final sale price for homes that sold below asking. Average concessions measures seller-paid closing cost contributions.
The dataset includes more than 2.1 million individual transactions. Information is deemed reliable but not guaranteed.