By Otto Acosta, Offerpad Research Team | Published April 3, 2026 | Data current through March 2026
In the summer of 2023, a well-priced single-family home in Columbus, Ohio spent about 27 days on the market before a buyer closed the deal. Fast-forward to early 2026, and that same type of home now takes 53 days. In San Antonio, the wait has stretched past 100.
Something shifted in the American housing market, and sellers who have not been paying close attention may be caught off guard by how much slower things have gotten.
Offerpad analyzed multiple listing service data across 15 major metropolitan areas, covering more than 350,000 single-family home transactions over 39 months. The conclusion: selling a home in 2026 takes meaningfully longer than it did even one year ago, and that is true in every city we examined.
How Long It Takes to Sell a House in Every Major Market
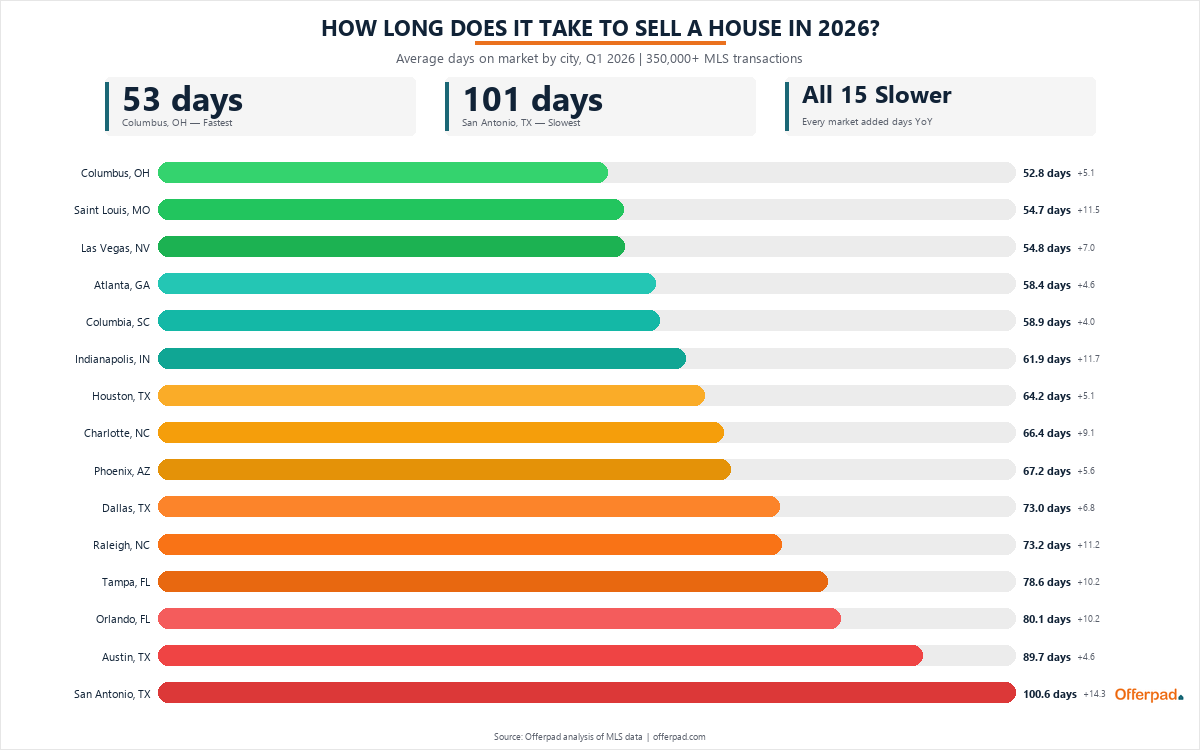
These are the average days on market for single-family homes that closed in the first three months of 2026, ranked from fastest to slowest.
Average Days on Market: Q1 2026
| Rank | City | Days on Market | Change from Q1 2025 |
|---|---|---|---|
| 1 | Columbus, OH | 52.8 | +5.1 days (+10.6%) |
| 2 | Las Vegas, NV | 54.8 | +7.0 days (+14.6%) |
| 3 | Saint Louis, MO | 54.7 | +11.5 days (+26.6%) |
| 4 | Atlanta, GA | 58.4 | +4.6 days (+8.5%) |
| 5 | Columbia, SC | 58.9 | +4.0 days (+7.4%) |
| 6 | Indianapolis, IN | 61.9 | +11.7 days (+23.3%) |
| 7 | Houston, TX | 64.2 | +5.1 days (+8.6%) |
| 8 | Charlotte, NC | 66.4 | +9.1 days (+15.9%) |
| 9 | Phoenix, AZ | 67.2 | +5.6 days (+9.1%) |
| 10 | Dallas, TX | 73.0 | +6.8 days (+10.3%) |
| 11 | Raleigh, NC | 73.2 | +11.2 days (+18.1%) |
| 12 | Tampa, FL | 78.6 | +10.2 days (+14.9%) |
| 13 | Orlando, FL | 80.1 | +10.2 days (+14.6%) |
| 14 | Austin, TX | 89.7 | +4.6 days (+5.4%) |
| 15 | San Antonio, TX | 100.6 | +14.3 days (+16.6%) |
Source: Offerpad analysis of MLS data for single-family homes, Q1 2026 vs. Q1 2025.
Every city on this list is slower than it was a year ago. The gap between the fastest market (Columbus at 53 days) and the slowest (San Antonio at 101 days) is nearly seven weeks.
Where Homes Sell Fastest in 2026
Three markets stand out for relatively brisk transaction timelines.
Columbus, Ohio (52.8 days) holds the top spot. Columbus benefits from a relatively affordable price point ($370,000 median in March 2026) and a diversified economy anchored by Ohio State University, healthcare, and a growing tech sector. More than 27% of homes there still sold above asking price in March 2026, suggesting healthy buyer competition on well-priced listings.
Las Vegas, Nevada (54.8 days) remains among the fastest markets despite a 14.6% year-over-year increase in selling times. Sellers in Las Vegas paid zero in average concessions in March 2026, and 17.2% of homes sold above asking, indicating that buyers who do enter the market are competing aggressively.
Saint Louis, Missouri (54.7 days) is the sleeper market in this dataset. At a $300,000 median price, it posted the highest above-list rate of any city by a wide margin: 35.7% of homes sold above asking in March 2026, nearly double the next-closest market. For sellers in Saint Louis, the market may feel less like a slowdown and more like a return to balance from the frenzy of 2022-2023.
Where Homes Take the Longest to Sell
At the bottom of the ranking, four cities stand well apart from the rest.
San Antonio, Texas (100.6 days) is the only market to cross 100 days. San Antonio added 14.3 days year-over-year, with an average price drop of $19,195 before closing. A post-pandemic building boom has added inventory faster than in most cities, giving buyers more choices and less urgency. The result is a market where sellers face both extended timelines and meaningful price concessions.
Austin, Texas (89.7 days) continues adjusting from its pandemic peak, when the metro was among the fastest-appreciating in the country. The average price drop of $23,833 is the second-highest in the dataset, and only 9.4% of homes sold above asking. Austin’s correction has been gradual but persistent.
Orlando, Florida (80.1 days) saw the largest absolute slowdown between 2024 and 2025, adding 13.4 days to the average, and is still decelerating in 2026. Rising insurance costs and elevated mortgage rates have cooled what was one of the hottest pandemic-era markets.
Tampa, Florida (78.6 days) recorded the largest percentage increase in days on market between 2024 and 2025 (27.2%). Insurance costs that have more than doubled in many Florida markets since 2022 have added a hidden drag on buyer enthusiasm that does not show up in headline price figures.
A Slowdown That Came in Stages
This did not happen overnight. The deceleration started in 2024, gained momentum through 2025, and is still accelerating in early 2026.
Consider Tampa. In 2024, the average home there sold in about 56 days. By 2025, that had climbed to 71 days, a 27% increase and the fastest rate of change among all 15 markets. In the first three months of 2026, Tampa homes averaged 79 days before closing.
Tampa is an extreme case, but it is not an outlier. Every market in the dataset followed the same arc. No market got faster.
Year-Over-Year DOM Change: 2024 vs. 2025
| Market | 2024 Avg. | 2025 Avg. | Change | % Change |
|---|---|---|---|---|
| Tampa, FL | 55.9 | 71.0 | +15.2 | +27.2% |
| Orlando, FL | 56.7 | 70.1 | +13.4 | +23.6% |
| Raleigh, NC | 45.9 | 56.0 | +10.1 | +22.1% |
| Dallas, TX | 51.5 | 61.1 | +9.6 | +18.7% |
| Charlotte, NC | 40.7 | 49.9 | +9.2 | +22.5% |
| Phoenix, AZ | 53.2 | 61.9 | +8.7 | +16.3% |
| Atlanta, GA | 40.3 | 49.0 | +8.6 | +21.4% |
| San Antonio, TX | 72.9 | 80.9 | +8.0 | +11.0% |
| Las Vegas, NV | 38.5 | 45.5 | +7.0 | +18.2% |
| Austin, TX | 70.7 | 76.3 | +5.6 | +7.9% |
| Saint Louis, MO | 34.9 | 39.8 | +4.9 | +14.1% |
| Houston, TX | 49.6 | 54.5 | +4.9 | +9.8% |
| Indianapolis, IN | 35.2 | 39.6 | +4.4 | +12.4% |
| Columbia, SC | 45.4 | 48.3 | +3.0 | +6.5% |
| Columbus, OH | 37.4 | 39.0 | +1.6 | +4.2% |
Columbus held up best with only 1.6 days added. Tampa added the most at 15.2.
The early 2026 data shows the trend continuing. Comparing Q1 2026 to Q1 2025, Saint Louis jumped 26.6% (adding nearly 12 days), Indianapolis added 11.7 days (a 23.3% increase), and San Antonio crossed the 100-day mark for the first time.
What is driving this? The common thread across markets is affordability pressure. Mortgage rates that have stayed elevated above 6.5% for most of the past 18 months have thinned the pool of qualified buyers. Sellers, meanwhile, have been reluctant to cut prices, creating a standoff where homes sit longer as both sides wait for the other to blink.
Best Time of Year to Sell a House
Seasonality has a measurable impact on how fast homes sell. Across all 15 markets and all years in the dataset:
| Month | Average Days on Market |
|---|---|
| July | 44.0 days |
| June | 44.6 days |
| August | 45.9 days |
| May | 46.2 days |
| September | 48.9 days |
| April | 49.7 days |
| October | 50.5 days |
| November | 52.9 days |
| December | 57.2 days |
| March | 59.2 days |
| January | 60.4 days |
| February | 62.1 days |
Homes closing in summer (May through August) spent an average of 45.2 days on market. Homes closing in winter (December through February) spent 59.9 days. That is a 33% penalty for winter sellers.
But the seasonal swing varies widely by city.
Markets with the biggest seasonal swings (summer 2025 vs. winter 2025-26):
| Market | Summer Avg. | Winter Avg. | Seasonal Swing |
|---|---|---|---|
| Indianapolis, IN | 31.1 days | 57.0 days | +25.9 days |
| Austin, TX | 66.3 days | 91.9 days | +25.6 days |
| San Antonio, TX | 73.5 days | 98.9 days | +25.4 days |
| Raleigh, NC | 48.2 days | 72.8 days | +24.6 days |
| Charlotte, NC | 42.4 days | 64.5 days | +22.1 days |
Indianapolis shows the most extreme pattern: homes there sell nearly twice as fast during summer as they do in winter. Midwest and Southeast markets generally show larger seasonal swings.
Markets where seasonality matters less:
Phoenix (8-day swing) and Tampa (10-day swing) show the smallest seasonal differences. Phoenix’s winter is actually its busiest season for buyer activity, as relocating buyers and snowbirds shop during cooler months. Tampa benefits from steady year-round migration from the Northeast.
For sellers who have flexibility on timing, listing in spring for a summer closing can shave anywhere from 8 to 26 days off the expected timeline. In Indianapolis, that timing advantage alone is worth nearly a month.
The Financial Cost of Waiting
Time on market is not just an inconvenience. The data shows a clear relationship between how long homes sit and the financial terms of the sale.
In the fastest markets, sellers face modest price adjustments and have a strong chance of selling above asking price. In the slowest markets, price drops exceed $20,000 and seller concessions add thousands more to the cost of closing.
March 2026: The Financial Picture by Market
| Market | Avg. DOM | Avg. Price Drop | Avg. Concessions | % Over List |
|---|---|---|---|---|
| Columbus, OH | 50.1 | $7,890 | $0* | 27.1% |
| Las Vegas, NV | 50.4 | $11,352 | $0 | 17.2% |
| Saint Louis, MO | 53.1 | $5,925 | $1,876 | 35.7% |
| Atlanta, GA | 52.2 | $10,561 | $6,794 | 17.6% |
| Columbia, SC | 59.5 | $10,681 | $1,524 | 13.1% |
| Phoenix, AZ | 62.6 | $17,572 | $3,612 | 13.5% |
| Houston, TX | 62.1 | $12,805 | $219 | 10.3% |
| Indianapolis, IN | 63.3 | $9,917 | $2,727 | 12.2% |
| Charlotte, NC | 63.5 | $11,803 | $4,319 | 14.5% |
| Dallas, TX | 67.2 | $16,275 | $5,204 | 13.2% |
| Raleigh, NC | 68.9 | $10,920 | $3,035 | 14.4% |
| Tampa, FL | 77.8 | $23,799 | $5,156 | 9.5% |
| Orlando, FL | 79.1 | $18,993 | $4,417 | 9.6% |
| Austin, TX | 84.1 | $23,833 | $4,560 | 9.4% |
| San Antonio, TX | 99.5 | $19,195 | $6,874 | 10.5% |
\*Columbus concessions data shows as $0 or negative, which may reflect a reporting methodology difference in that market’s MLS.
The spread is stark. In Saint Louis, the typical seller drops their price by about $5,900 and has a 36% chance of selling above asking. In Austin, the typical price drop is nearly $24,000 and only 9% of homes beat their list price.
Prices Up, Selling Times Up: An Unexpected Pattern
A seller might assume that longer selling times mean a declining market. In more than half of these cities, that assumption is wrong.
Eight of 15 markets saw median prices increase between 2024 and 2025, even as homes took longer to sell:
| Market | DOM Change (2024 to 2025) | Median Price Change |
|---|---|---|
| Saint Louis, MO | +4.9 days | +5.6% |
| Indianapolis, IN | +4.4 days | +3.7% |
| Columbus, OH | +1.6 days | +2.9% |
| Charlotte, NC | +9.2 days | +2.9% |
| Columbia, SC | +3.0 days | +2.8% |
| Raleigh, NC | +10.1 days | +1.7% |
| Las Vegas, NV | +7.0 days | +1.7% |
| Phoenix, AZ | +8.7 days | +0.7% |
This defies the typical assumption that a slowing market means a declining market. What it suggests instead is a housing environment where inventory is still tight enough to support prices, but where buyer hesitation — driven by mortgage rates and affordability ceilings — is stretching the transaction timeline. The result for sellers in these eight cities: you will likely still get your price, but you will wait longer for it.
Markets where both selling times and prices are moving in the wrong direction tell a different story. Tampa saw prices drop 3.1%, Dallas fell 1.4%, and Houston dipped 0.9%, all while homes sat longer. These markets may be in the early stages of a more traditional correction, where slower sales eventually pull prices down.
What This Data Means for Home Sellers in 2026
The 39 months of data in this analysis point to several practical takeaways for anyone considering selling a home this year.
Build more time into your plan. The average across all 15 markets is 67 days in Q1 2026, but markets like San Antonio, Austin, and Orlando are running well above that. If you are planning a move tied to a specific date for a job relocation or other life event, exploring your selling options early gives you the most flexibility. Some sellers are turning to cash offers as a way to lock in a closing date and avoid the uncertainty of an extended listing period.
List in spring if you can. Homes closing in summer sell about 15 days faster on average than homes closing in winter. In markets like Indianapolis and Austin, the seasonal advantage is 25 or more days. For a seller in Indianapolis, listing in March for a June close versus listing in October for a January close could mean the difference between 31 days on market and 57.
Price accurately from the start. The data shows a strong relationship between extended time on market and price reductions. In a market where the average price drop already exceeds $20,000 in some cities, overpricing compounds the financial cost of waiting. Understanding your home’s current market value before setting a list price helps set realistic expectations.
Know your local market. The difference between Columbus (53 days, 27% selling above list) and San Antonio (101 days, 11% above list) is enormous. National housing headlines often miss these city-level differences. The costs of selling a home vary just as much as the timelines, and understanding both is part of making an informed decision.
Methodology: This analysis is based on aggregated multiple listing service data for single-family home transactions from January 2023 through March 2026 across 15 metropolitan markets where Offerpad operates. All statistics represent market-wide transaction data, not Offerpad-specific transactions. Jacksonville, FL was excluded from this analysis due to MLS data licensing restrictions. Data from one additional market file was unavailable at the time of analysis. Information is deemed reliable but not guaranteed.
Markets analyzed: Atlanta, GA; Austin, TX; Charlotte, NC; Columbia, SC; Columbus, OH; Dallas, TX; Houston, TX; Indianapolis, IN; Las Vegas, NV; Orlando, FL; Phoenix, AZ; Raleigh, NC; Saint Louis, MO; San Antonio, TX; Tampa, FL.
About the source data: Offerpad analyzed MLS data covering single-family home transactions in 15 metropolitan markets where the company operates. The dataset includes monthly aggregated metrics: closed property count, median close price, median price per square foot, average price drop from initial listing, average days on market, average seller concessions, and percentage of homes selling above list price. Data spans January 2023 through March 2026 (39 months per market, covering more than 350,000 total transactions).