By Otto Acosta, Offerpad Research Team | Published April 2, 2026 | Data current through March 2026
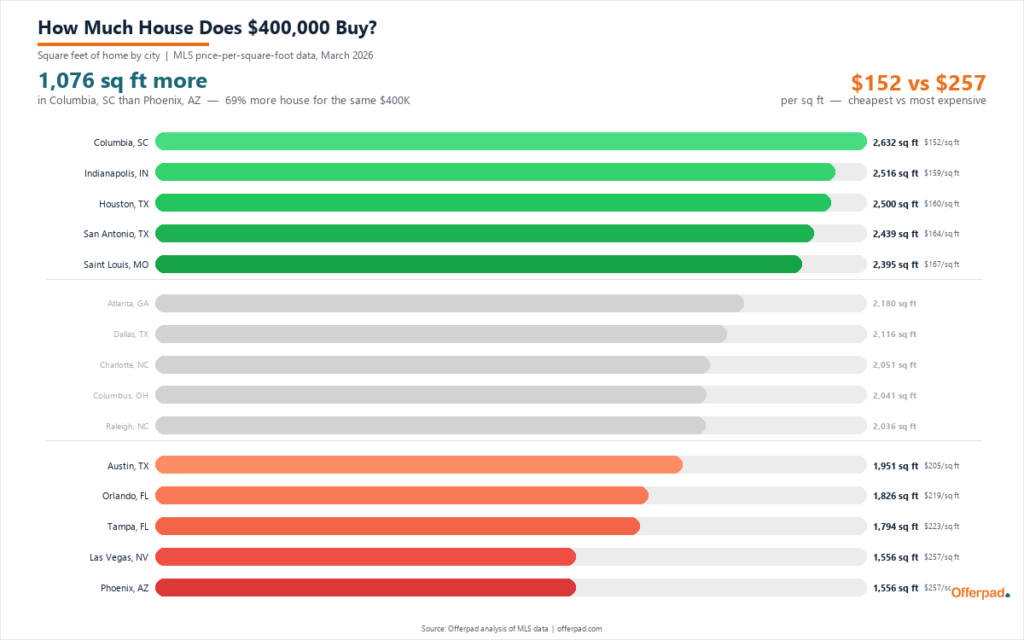
Walk into a real estate office in Columbia, South Carolina with a $400,000 budget and you could be touring a 2,600-square-foot home with four bedrooms, a two-car garage, and a backyard big enough for a swing set. Fly to Phoenix with the same check in hand and you are looking at closer to 1,550 square feet: a three-bedroom, maybe two-bath, with a compact patio.
Same money. Same country. A thousand square feet of difference.
That gap, enough space to fit an entire one-bedroom apartment, is one of the clearest illustrations of how differently housing markets price the same commodity across American cities. And it is not standing still. Over the past three years, some markets have gotten cheaper while others have moved in the opposite direction, reshuffling the map of where a middle-class budget stretches furthest.
Offerpad analyzed MLS transaction data across 15 major metropolitan areas, covering single-family home sales from January 2023 through March 2026. The question: if you had $400,000, how much living space would it buy in each city, and has that answer changed?
How Much House Does $400,000 Buy? The Full Ranking
This table ranks all 15 metros by how many square feet of home a $400,000 budget purchases, based on each market’s median price per square foot in March 2026.
| Rank | City | Price/Sq Ft | Sq Ft for $400K | Median Home Price | Implied Home Size |
|---|---|---|---|---|---|
| 1 | Columbia, SC | $152 | 2,632 | $291,700 | 1,919 sq ft |
| 2 | Indianapolis, IN | $159 | 2,516 | $300,000 | 1,887 sq ft |
| 3 | Houston, TX | $160 | 2,500 | $340,695 | 2,129 sq ft |
| 4 | San Antonio, TX | $164 | 2,439 | $330,000 | 2,012 sq ft |
| 5 | Saint Louis, MO | $167 | 2,395 | $300,000 | 1,796 sq ft |
| 6 | Atlanta, GA | $184 | 2,180 | $420,000 | 2,289 sq ft |
| 7 | Dallas, TX | $189 | 2,116 | $399,000 | 2,111 sq ft |
| 8 | Charlotte, NC | $195 | 2,051 | $378,950 | 1,943 sq ft |
| 9 | Columbus, OH | $196 | 2,041 | $370,000 | 1,888 sq ft |
| 10 | Raleigh, NC | $197 | 2,036 | $404,545 | 2,059 sq ft |
| 11 | Austin, TX | $205 | 1,951 | $425,000 | 2,073 sq ft |
| 12 | Orlando, FL | $219 | 1,826 | $409,995 | 1,872 sq ft |
| 13 | Tampa, FL | $223 | 1,794 | $400,000 | 1,794 sq ft |
| 14 | Las Vegas, NV | $257 | 1,556 | $480,000 | 1,868 sq ft |
| 15 | Phoenix, AZ | $257 | 1,556 | $490,000 | 1,907 sq ft |
Source: Offerpad analysis of MLS data for single-family homes, March 2026. Implied home size = median close price / median price per square foot, an approximation of typical home size in each market.
The five most affordable markets all price below $170 per square foot and deliver at least 2,395 square feet for $400,000, enough for a four-bedroom home in most floor plans. The two most expensive, Las Vegas and Phoenix, both hit $257 per square foot and deliver 1,556 square feet, closer to a compact three-bedroom.
Where $400,000 Goes the Furthest
Columbia, South Carolina ($152/sq ft, 2,632 sq ft) tops the list and it is not close. At $291,700, the median home there already costs well under $400,000, which means a buyer with this budget has room to shop above the market’s median price point, with access to newer construction, larger lots, and more desirable neighborhoods. Columbia’s economy has diversified beyond its military and government base, with logistics, healthcare, and the University of South Carolina driving steady population growth. But the housing stock has kept pace, and building costs remain lower than in most Sun Belt competitors.
Indianapolis, Indiana ($159/sq ft, 2,516 sq ft) ranks second. The city’s $300,000 median price is among the lowest in the dataset, and Midwest labor and material costs keep construction affordable. In practical terms: a family moving from Phoenix to Indianapolis with the same $400,000 budget picks up 960 extra square feet, enough for two additional bedrooms and a bonus room.
Houston, Texas ($160/sq ft, 2,500 sq ft) rounds out the top three. Houston also has the largest implied home sizes in the dataset: the typical home sold in March 2026 was about 2,129 square feet, a reflection of the sprawling Texas building tradition where land has historically been cheap and homes are built wide. The city has no municipal zoning code, which keeps development flexible and inventory relatively abundant.
Where $400,000 Buys the Least
At the other end of the spectrum, buyers with a $400,000 budget are shopping below the median price and making compromises on space.
Phoenix, Arizona ($257/sq ft, 1,556 sq ft) and Las Vegas, Nevada ($257/sq ft, 1,556 sq ft) share the bottom two spots. Despite the identical cost per square foot, Phoenix carries a higher median price ($490,000 vs. $480,000), suggesting that typical homes in Phoenix tend to be slightly larger. Both are desert metros with natural land constraints: Phoenix is ringed by mountains, reservations, and national forest, while Las Vegas occupies a valley with limited buildable area. When demand rises, there is less room to sprawl, and that geographic constraint keeps per-square-foot prices higher.
Tampa, Florida ($223/sq ft, 1,794 sq ft) is the third most expensive market on this list. Homeowners insurance in many Florida markets has more than doubled since 2022, adding thousands of dollars per year in carrying costs that do not appear in price-per-square-foot data but reshape what buyers can actually afford. Tampa’s cost story extends well beyond the sticker price.
How $400,000 Compares to the Local Median
Understanding where $400,000 falls relative to each city’s median frames what kind of buyer experience to expect. In markets where the median is below $400,000, that budget puts buyers above the midpoint with a wider selection. Where the median exceeds $400,000, buyers are shopping in the lower half of the market and may need to compromise on location, size, or condition.
$400K is above the median in: Columbia ($292K), Indianapolis ($300K), Saint Louis ($300K), San Antonio ($330K), Houston ($341K), Columbus ($370K), Charlotte ($379K)
$400K is near the median in: Dallas ($399K), Tampa ($400K), Raleigh ($405K), Orlando ($410K)
$400K is below the median in: Atlanta ($420K), Austin ($425K), Las Vegas ($480K), Phoenix ($490K)
How Purchasing Power Has Shifted Since 2023
The more telling story is the trajectory. Where is $400,000 buying more house than it did three years ago, and where has it lost ground? The table below compares each market’s average price per square foot in 2023 to the first quarter of 2026, sorted by the direction of change.
| Market | 2023 Avg $/Sq Ft | Q1 2026 $/Sq Ft | Change | $400K Bought (2023) | $400K Buys (Q1 2026) | Sq Ft Change |
|---|---|---|---|---|---|---|
| Austin, TX | $213 | $196 | -8.1% | 1,876 | 2,041 | +164 |
| San Antonio, TX | $171 | $159 | -7.2% | 2,339 | 2,521 | +182 |
| Tampa, FL | $229 | $218 | -4.7% | 1,746 | 1,832 | +86 |
| Dallas, TX | $195 | $186 | -4.3% | 2,055 | 2,147 | +92 |
| Houston, TX | $161 | $158 | -1.8% | 2,482 | 2,526 | +44 |
| Orlando, FL | $220 | $216 | -1.6% | 1,820 | 1,849 | +29 |
| Raleigh, NC | $194 | $194 | -0.3% | 2,061 | 2,067 | +6 |
| Atlanta, GA | $180 | $180 | Flat | 2,223 | 2,224 | +1 |
| Phoenix, AZ | $250 | $255 | +2.1% | 1,599 | 1,567 | -32 |
| Charlotte, NC | $186 | $194 | +4.4% | 2,153 | 2,062 | -91 |
| Indianapolis, IN | $150 | $156 | +4.5% | 2,674 | 2,559 | -115 |
| Columbia, SC | $141 | $149 | +6.1% | 2,841 | 2,679 | -163 |
| Las Vegas, NV | $240 | $255 | +6.3% | 1,665 | 1,567 | -98 |
| Columbus, OH | $180 | $192 | +7.0% | 2,225 | 2,080 | -145 |
| Saint Louis, MO | $145 | $159 | +9.5% | 2,759 | 2,521 | -238 |
Source: Offerpad analysis of MLS data, Jan 2023-Mar 2026. 2023 values are 12-month averages; Q1 2026 values are Jan-Mar 2026 averages.
The data splits into two groups. Eight markets got cheaper per square foot, meaning $400,000 buys more space today. Seven got more expensive, meaning it buys less. But the pattern is not random. It maps to a specific story about which markets overshot during the pandemic and which ones are catching up.
The Texas Correction: Buyers Gaining Ground
Three of the four Texas markets on this list saw per-square-foot costs fall since 2023, making Texas the clearest affordability story in the data.
Austin leads the way. The metro that was a national symbol of pandemic-era price explosions has now seen three consecutive years of declining per-square-foot costs: $213 to $211 to $206 to $196. That 8.1% drop means a $400,000 buyer today gets 164 more square feet than in 2023, a gain equivalent to a bedroom or a large home office.
The correction has been persistent but not abrupt. A combination of new construction in the suburbs, a tech hiring slowdown that reduced in-migration, and a pricing overshoot that left the market with room to compress has driven prices back to levels not seen since early 2022.
San Antonio gained the most raw square footage of any market: 182 additional square feet for the same $400,000. Per-square-foot cost dropped from $171 to $159 over three years, the second-largest percentage decline after Austin. A post-pandemic building boom, particularly in the north and northwest suburbs, has kept inventory high and given buyers the upper hand. Homes in San Antonio now spend an average of 100 days on market, the longest of any city in this dataset.
Dallas gained 92 square feet (-4.3% in per-square-foot cost). Houston gained a more modest 44 square feet (-1.8%). Houston was already among the most affordable markets and had less room to compress.
Affordable Markets Getting Less Affordable: The Midwest Pattern
If Texas is the correction story, the Midwest and Southeast tell the opposite one. The markets that were the best deals in 2023 have appreciated the fastest, narrowing the gap with pricier cities.
Saint Louis recorded the largest price-per-square-foot increase in the dataset: 9.5%, from $145 to $159 on average. That translates to 238 fewer square feet for a $400,000 budget, the biggest loss of purchasing power on this list. Yet the market remains the fifth most affordable overall, and 35.7% of homes sold above asking price in March 2026, more than double the rate of any other city. Buyers are discovering Saint Louis, and they are competing aggressively.
Columbus, Ohio appreciated 7.0% ($180 to $192), costing buyers 145 square feet. Columbia, South Carolina rose 6.1% ($141 to $149), losing 163 square feet of buying power but remaining the single most affordable market on the list. Indianapolis followed the same pattern: a 4.5% increase erased 115 square feet.
Even with these increases, all four markets still deliver more than 2,000 square feet for $400,000. They are still good deals by national standards. They are just less exceptional than they were three years ago.
How Home Prices Moved Year by Year
The annual breakdown shows whether changes happened gradually or in specific years.
| Market | 2023 | 2024 | 2025 | Q1 2026 | Pattern |
|---|---|---|---|---|---|
| Columbia, SC | $141 | $146 | $150 | $149 | Steady rise, leveling off |
| Saint Louis, MO | $145 | $152 | $157 | $159 | Consistent climb |
| Indianapolis, IN | $150 | $155 | $159 | $156 | Rose then eased |
| Houston, TX | $161 | $164 | $162 | $158 | Peaked 2024, now falling |
| San Antonio, TX | $171 | $168 | $163 | $159 | Three straight years down |
| Atlanta, GA | $180 | $186 | $184 | $180 | Round-trip to 2023 level |
| Columbus, OH | $180 | $189 | $193 | $192 | Steady climb |
| Charlotte, NC | $186 | $195 | $197 | $194 | Rose sharply, now easing |
| Dallas, TX | $195 | $197 | $192 | $186 | Peaked 2024, now declining |
| Raleigh, NC | $194 | $198 | $199 | $194 | Round-trip to 2023 |
| Austin, TX | $213 | $211 | $206 | $196 | Accelerating decline |
| Orlando, FL | $220 | $225 | $220 | $216 | Peaked 2024, declining |
| Tampa, FL | $229 | $228 | $220 | $218 | Steady decline |
| Las Vegas, NV | $240 | $256 | $260 | $255 | Sharp 2024 jump, now flat |
| Phoenix, AZ | $250 | $258 | $256 | $255 | Rose 2024, plateaued |
Source: Offerpad analysis of MLS data. Annual figures are 12-month averages. Q1 2026 = January through March 2026.
A few patterns stand out:
Austin’s correction is accelerating. The steepest annual drop occurred in the most recent period ($206 to $196), suggesting the market has not yet found its floor.
San Antonio is the only market to decline in each period measured. From $171 to $168 to $163 to $159, it has moved in one direction for three full years.
Atlanta and Raleigh completed a round-trip. Both rose in 2024, eased in 2025, and returned to within a dollar of their 2023 per-square-foot levels. A buyer in either city today is paying roughly what they would have three years ago.
Las Vegas and Phoenix jumped in 2024 and held. Both added more than $15 per square foot between 2023 and 2024, then leveled off. Limited buildable land in both desert metros constrains supply even as demand cools.
Best Time of Year to Buy: The Seasonal Pattern
Across all 15 markets and all years in the dataset, price per square foot follows a consistent seasonal cycle.
| Season | Avg Price/Sq Ft | Sq Ft for $400K | vs. Winter |
|---|---|---|---|
| Winter (Jan-Feb) | $189 | 2,118 | Baseline |
| Spring (Mar-May) | $195 | 2,054 | -64 sq ft |
| Summer (Jun-Aug) | $196 | 2,041 | -77 sq ft |
| Fall (Sep-Nov) | $193 | 2,072 | -46 sq ft |
Source: Offerpad analysis of MLS data, all 15 markets, 2023-2026.
A $400,000 buyer who closes in January or February gets about 77 more square feet than one who closes in the summer months. The seasonal effect is small compared to the gap between cities (where the spread exceeds 1,000 square feet), but for a buyer locked into a specific market, buying in winter is one of the few timing levers that consistently delivers more space for the same price.
What the Broader Market Looks Like
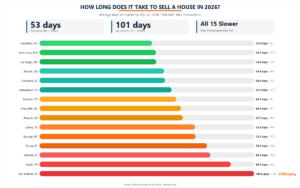
Price per square foot tells part of the story. How long homes sit on the market, how much prices drop before closing, and whether homes sell above asking all shape the buying experience at any budget level. For a full analysis of selling timelines in these same markets, see Offerpad’s city-by-city days-on-market breakdown.
| Market | Days on Market | Avg Price Drop | % Sold Over Asking |
|---|---|---|---|
| Columbus, OH | 50 | $7,890 | 27.1% |
| Las Vegas, NV | 50 | $11,352 | 17.2% |
| Atlanta, GA | 52 | $10,561 | 17.6% |
| Saint Louis, MO | 53 | $5,925 | 35.7% |
| Columbia, SC | 60 | $10,681 | 13.1% |
| Houston, TX | 62 | $12,805 | 10.3% |
| Indianapolis, IN | 63 | $9,917 | 12.2% |
| Phoenix, AZ | 63 | $17,572 | 13.5% |
| Charlotte, NC | 64 | $11,803 | 14.5% |
| Dallas, TX | 67 | $16,275 | 13.2% |
| Raleigh, NC | 69 | $10,920 | 14.4% |
| Tampa, FL | 78 | $23,799 | 9.5% |
| Orlando, FL | 79 | $18,993 | 9.6% |
| Austin, TX | 84 | $23,833 | 9.4% |
| San Antonio, TX | 100 | $19,195 | 10.5% |
Source: Offerpad analysis of MLS data, March 2026.
Two markets stand out for the contrast between their per-square-foot affordability and their competitiveness:
Saint Louis is the fifth most affordable market by price per square foot, but 35.7% of homes sold above asking in March 2026, the highest rate in the entire dataset. The same affordability numbers that place Saint Louis near the top of this ranking have attracted buyers who are competing aggressively for the best properties.
Austin and San Antonio offer some of the largest square footage gains since 2023, but they also have the longest days on market (84 and 100 days) and the largest average price drops ($23,833 and $19,195). That combination means buyers have negotiating leverage but should expect a slower process.
What This Means for Homebuyers
This data does not tell anyone where to live. People choose cities for jobs, family, climate, schools, and reasons that have nothing to do with price per square foot.
But for buyers who have flexibility, or who are weighing offers in multiple markets, these numbers frame the tradeoff in concrete terms.
A family deciding between Atlanta and Indianapolis gets 336 more square feet (15%) in Indianapolis for the same $400,000. That could be the difference between a three-bedroom with a cramped office and a four-bedroom with a dedicated workspace.
A remote worker choosing between Austin and San Antonio gains 488 extra square feet (25%) by picking San Antonio. That is roughly enough for a master suite with a walk-in closet.
A retiree comparing Tampa and Columbia gets 838 more square feet (47%) in Columbia, the size of a small apartment added onto their home.
These comparisons are calculated from market-level medians rather than individual listings, and actual homes at $400,000 will vary by neighborhood, condition, and age. But they put a number on a gap that affects what families can afford, how much room children have, and whether a home feels like enough.
Methodology
This analysis is based on aggregated multiple listing service data for single-family home transactions from January 2023 through March 2026 across 15 metropolitan markets where Offerpad operates. All statistics represent market-wide transaction data, not Offerpad-specific transactions. Information is deemed reliable but not guaranteed.
Markets included: Atlanta, Austin, Charlotte, Columbia (SC), Columbus (OH), Dallas, Houston, Indianapolis, Las Vegas, Orlando, Phoenix, Raleigh, Saint Louis, San Antonio, Tampa.
About the metrics: Median close price is the midpoint of all single-family home sale prices in a given market and month. Median price per square foot is the midpoint of per-square-foot transaction prices. “Implied home size” is calculated by dividing median close price by median price per square foot. This approximates typical home size but is not a direct measurement of median square footage, as it reflects the mix of properties that sold rather than a measured median of individual home sizes.
About the $400,000 benchmark: This figure approximates the national median existing single-family home sale price and serves as a standardized point of comparison across markets. Actual homes available at $400,000 will vary by neighborhood, age, condition, lot size, and time of year.
Time periods: “2023” refers to the January through December 2023 average. “Q1 2026” refers to the January through March 2026 average. Seasonal data uses cross-market, cross-year averages across all 39 months in the dataset.
What this analysis does not include: Individual property listings, Offerpad-specific transaction data, foreclosures, new construction as a separate category, or condominiums and townhomes. Only closed single-family home resale transactions are included.