By Otto Acosta, Offerpad Research Team
Two people hold the same license, in the same state, with the same words on their business cards. One closes a deal most weeks and clears well into six figures. The other sold a single house last year and waits tables to cover the months in between. Government wage data counts them both, adds everyone like them, and reports a midpoint. That midpoint is where the real story begins.
How much do real estate agents make?
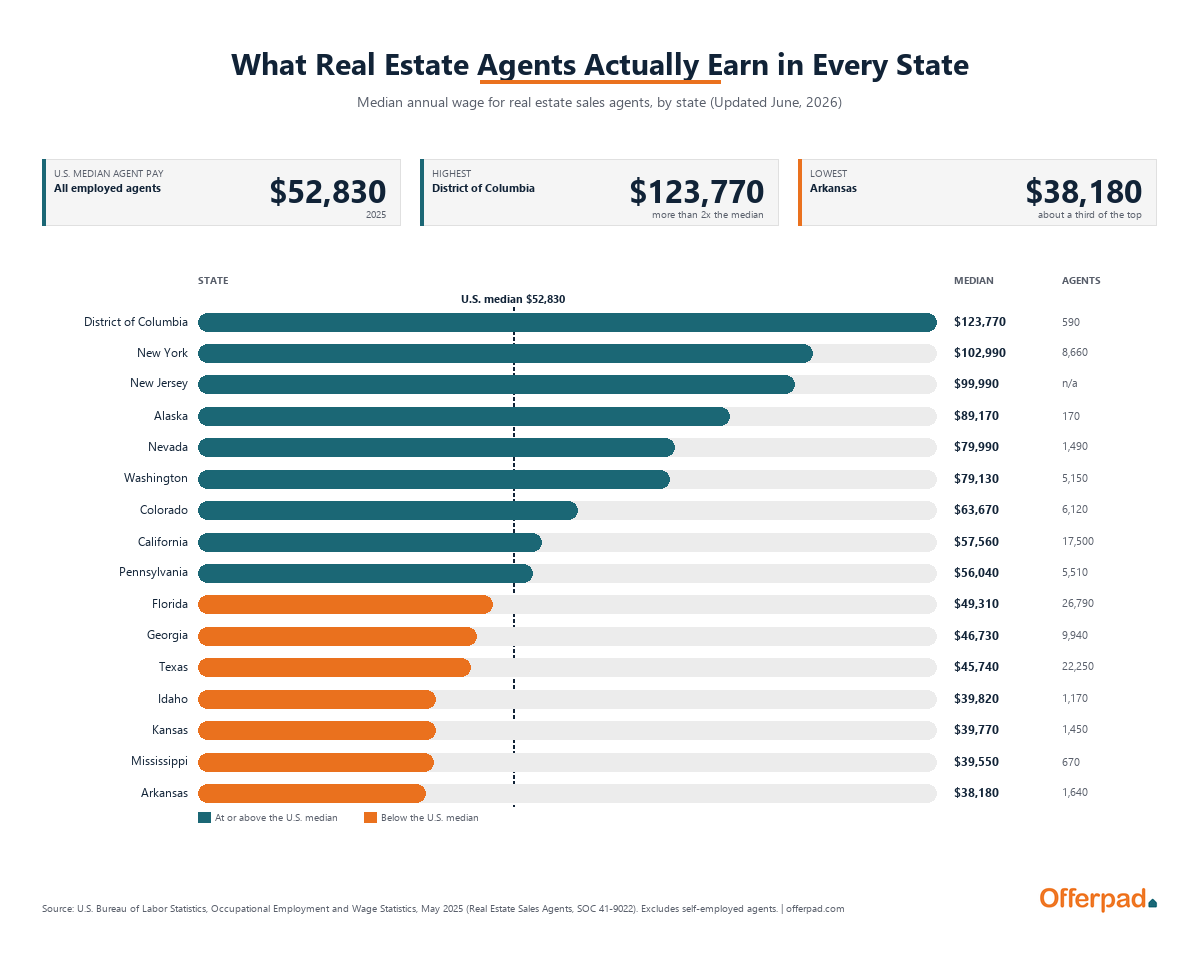
The typical real estate agent in the United States earned $52,830 in 2025, according to the U.S. Bureau of Labor Statistics (BLS) Occupational Employment and Wage Statistics program. Across the states, the middle figure ran from about $38,000 in the lowest-paying state to roughly $124,000 in the highest. The gap between the typical agent and the top earners was wider still. The median is an honest number, but almost no one actually earns it, because the job splits into a small group that does very well and a large group that barely does the job at all.
Here is what agent pay looks like across the country, why the average and the median tell two different stories, and what the most-cited figure leaves out.
National agent pay at a glance
- Median annual wage (2025): $52,830
- Average (mean) annual wage: $69,510
- Bottom 10 percent earned: $32,970 or less
- Top 10 percent earned: $123,590 or more
- Employed agents counted: 193,370
- Prior year, May 2024 release: a median of $56,320
The median is the midpoint, where half of employed agents earn more and half earn less. The average sits higher because a small number of top earners pull it upward. The distance between the bottom tenth and the top tenth, close to four to one, is the first sign that “real estate agent” is really two jobs sharing one title.
A second federal source points the same way. In the Census Bureau Current Population Survey, compiled by the Federal Reserve Bank of St. Louis as series LEU0254551700A, the median full-time real estate broker or agent earned about $1,392 a week in 2024, or roughly $72,000 a year. That survey counts full-time workers only. The occupational survey behind the $52,830 figure counts part-timers too, which is one reason its median lands lower. Who you count changes the answer.
Real estate agent salary by state
Agent pay tends to rise with home prices, so the highest-paying places are expensive ones. Here are the 10 states (plus the District of Columbia) where the typical agent earned the most in 2025.
| Rank | State | Median agent wage |
|---|---|---|
| 1 | District of Columbia | $123,770 |
| 2 | New York | $102,990 |
| 3 | New Jersey | $99,990 |
| 4 | Alaska | $89,170 |
| 5 | Nevada | $79,990 |
| 6 | Washington | $79,130 |
| 7 | Montana | $79,100 |
| 8 | New Mexico | $76,170 |
| 9 | North Dakota | $73,920 |
| 10 | South Dakota | $65,170 |
And the 10 where the typical agent earned the least.
| Rank | State | Median agent wage |
|---|---|---|
| 48 | Arkansas | $38,180 |
| 47 | Mississippi | $39,550 |
| 46 | Kansas | $39,770 |
| 45 | Idaho | $39,820 |
| 44 | Missouri | $43,960 |
| 43 | Texas | $45,740 |
| 42 | Louisiana | $45,850 |
| 41 | Hawaii | $46,220 |
| 40 | Ohio | $46,240 |
| 39 | Tennessee | $46,250 |
The District of Columbia sits at the top at $123,770, more than double the national figure, with a small and expensive market. New York leads the 50 states at $102,990, and New Jersey is close behind at $99,990. Several of the next names are thinly populated states, including Alaska, Montana, New Mexico, and the Dakotas, where a small roster of agents working active high-end markets lifts the midpoint. At the bottom, the typical agent in Arkansas earned $38,180, roughly a third of the District of Columbia figure.
A reader checking their own state often finds a surprise, because the places packed with agents are not the places agents earn the most. Florida has the largest agent workforce in the country, near 27,000, and a median of $49,310, below the national midpoint. Texas, with more than 22,000 agents, came in at $45,740. Georgia shows the same pattern, with close to 10,000 agents and a $46,730 median. More agents chasing the same number of homes leaves a thinner slice for each.
Why the median misleads: the spread inside each state
The gap between the highest- and lowest-paying states is about three to one. The gap inside a single state is often steeper, and that is the heart of the story.
Alabama makes it plain. The typical agent there earned $60,890 in 2025, a little above the national median, a solid middle-class wage. But the top 10 percent of Alabama agents earned $236,210 or more, while the bottom 10 percent earned $24,750 or less. One license, close to a tenfold spread. South Carolina runs the same way, with a median of $56,580 against a 90th percentile of $189,590. In Florida, the average wage of $73,600 sits far above the median of $49,310, because a handful of high producers pull the average up and leave the typical agent well behind it.
This is what a median can bury. In a business paid almost entirely on commission, the people at the top write the average, and the middle is a different place. (BLS top-codes its highest wage values, so the upper figures should be read as “at least this much” rather than exact ceilings.)
Why most agents earn so little
The reason the typical number is low comes down to how many agents there are compared with how many homes actually change hands.
Most agents sell very little. The Consumer Federation of America studied 2,000 randomly selected agents at major firms in four metro areas, Central Pennsylvania, Orlando, Tucson, and Minneapolis. In its January 2024 report, “A Surfeit of Real Estate Agents 3,” it found that 49 percent of agents sold one home or none in the prior year, and 70 percent sold five or fewer. The group described residential real estate as “truly a part-time industry with most agents working sporadically and holding another job, often full-time.”
The work is concentrated among a few. Real estate analyst Mike DelPrete, drawing on CoreLogic data covering 3.4 million sales and 840,000 producing agents in 2024, found that the top 20 percent of agents handle 65 percent of all transactions. The busiest fifth averaged 26 sales a year. Everyone else averaged 3.5. The median agent lives in that quiet majority, which is exactly why the median looks the way it does.
The ranks have started to thin. Membership in the National Association of Realtors (NAR), the field’s largest trade group, dipped below 1.5 million in early 2025. The association built its 2026 budget on a baseline of about 1.2 million members, bracing for the agents who could not make the math work to keep leaving. That count tracks Realtors, who are dues-paying members of the association, not every licensed agent, so the full licensed population is larger. Faced with that squeeze, a growing number of agents lean on referral and partnership programs to earn a fee even on sales they do not list themselves.
Some of the pressure is recent. Changes from NAR’s commission settlement took effect on August 17, 2024, requiring written agreements with buyers, removing offers of compensation from listing databases, and putting commission rates plainly on the table as negotiable. The full effect on agent pay will take years of data to read.
The big caveat: who the data leaves out
One caveat shapes every figure above. The BLS occupational survey counts wage and salary workers, the people an employer pays and reports on a W-2. It does not count the self-employed or independent contractors, and most real estate agents work as independent contractors. So these wages describe employed, salaried agents and undercount the broader population, and the true spread across everyone who holds a license is almost certainly wider than even these numbers suggest. The agent who sold one house last year and works another job is the part of the picture the survey never quite captures.
Read the state rankings as a reliable floor, not the whole account. They show clearly that where an agent works changes the pay a great deal. They show even more clearly that how much an agent sells changes it far more. The two people we started with, the one clearing six figures and the one waiting tables, are not the exceptions in this business. To a large degree, they are the business.
Methodology
This analysis uses wage data from the U.S. Bureau of Labor Statistics Occupational Employment and Wage Statistics (OEWS) program, May 2025 release, for Real Estate Sales Agents (Standard Occupational Classification 41-9022) and Real Estate Brokers (41-9021). National and state estimates were drawn from the OEWS public data files at https://download.bls.gov/pub/time.series/oe/ and cross-checked against the BLS Public Data API at https://api.bls.gov/. The May 2024 comparison figure is from the OEWS May 2024 release at https://www.bls.gov/oes/current/oes419022.htm. The OEWS survey covers wage and salary workers and excludes self-employed and independent-contractor agents, who make up a large share of the field; reported wages therefore reflect employed agents and undercount the total population. BLS does not publish a median agent wage for Iowa, Massachusetts, or Vermont, which are excluded from the state ranking. Additional context is from the Federal Reserve Bank of St. Louis (FRED) Current Population Survey series LEU0254551700A (https://fred.stlouisfed.org/series/LEU0254551700A), the Consumer Federation of America’s “A Surfeit of Real Estate Agents 3,” January 2024 (https://consumerfed.org/reports/a-surfeit-of-real-estate-agents-3-abundant-jobs-inadequate-mentorship-and-few-sales/), Mike DelPrete’s analysis of CoreLogic data, May 2025 (https://www.mikedp.com/articles/2025/5/12/the-top-20-of-agents-do-65-of-transactions), and the National Association of Realtors (https://www.realestatenews.com/2025/11/17/nar-in-2026-a-new-plan-new-leaders-fewer-members). Information is deemed reliable but not guaranteed.