By Otto Acosta, Offerpad Research Team
A homeowner in St. Louis who sold a house in December 2025 walked away with a median sale price of roughly $290,000. The same kind of house, sold by the same kind of seller in the same city in December 2024, fetched roughly $275,000.
A homeowner in Tampa traveled the opposite road. The Tampa median in 2025 finished the year at $393,872, down about $13,600 from where it started.
Same calendar year. Same 30-year mortgage market. Same national headlines about a cooling housing market. Two opposite financial outcomes for two homeowners separated only by geography.
The 2025 housing market did not have a single story. It had at least sixteen.
The national headline numbers were quiet. The Federal Housing Finance Agency’s House Price Index (https://www.fhfa.gov/data/hpi) reported the slowest annual appreciation since 2011. The S&P CoreLogic Case-Shiller U.S. National Home Price Index (https://fred.stlouisfed.org/series/CSUSHPISA) finished 2025 only marginally above where it began. The National Association of Realtors’ existing-home sales report (https://www.nar.realtor/research-and-statistics/housing-statistics/existing-home-sales) showed median sale prices barely changed.
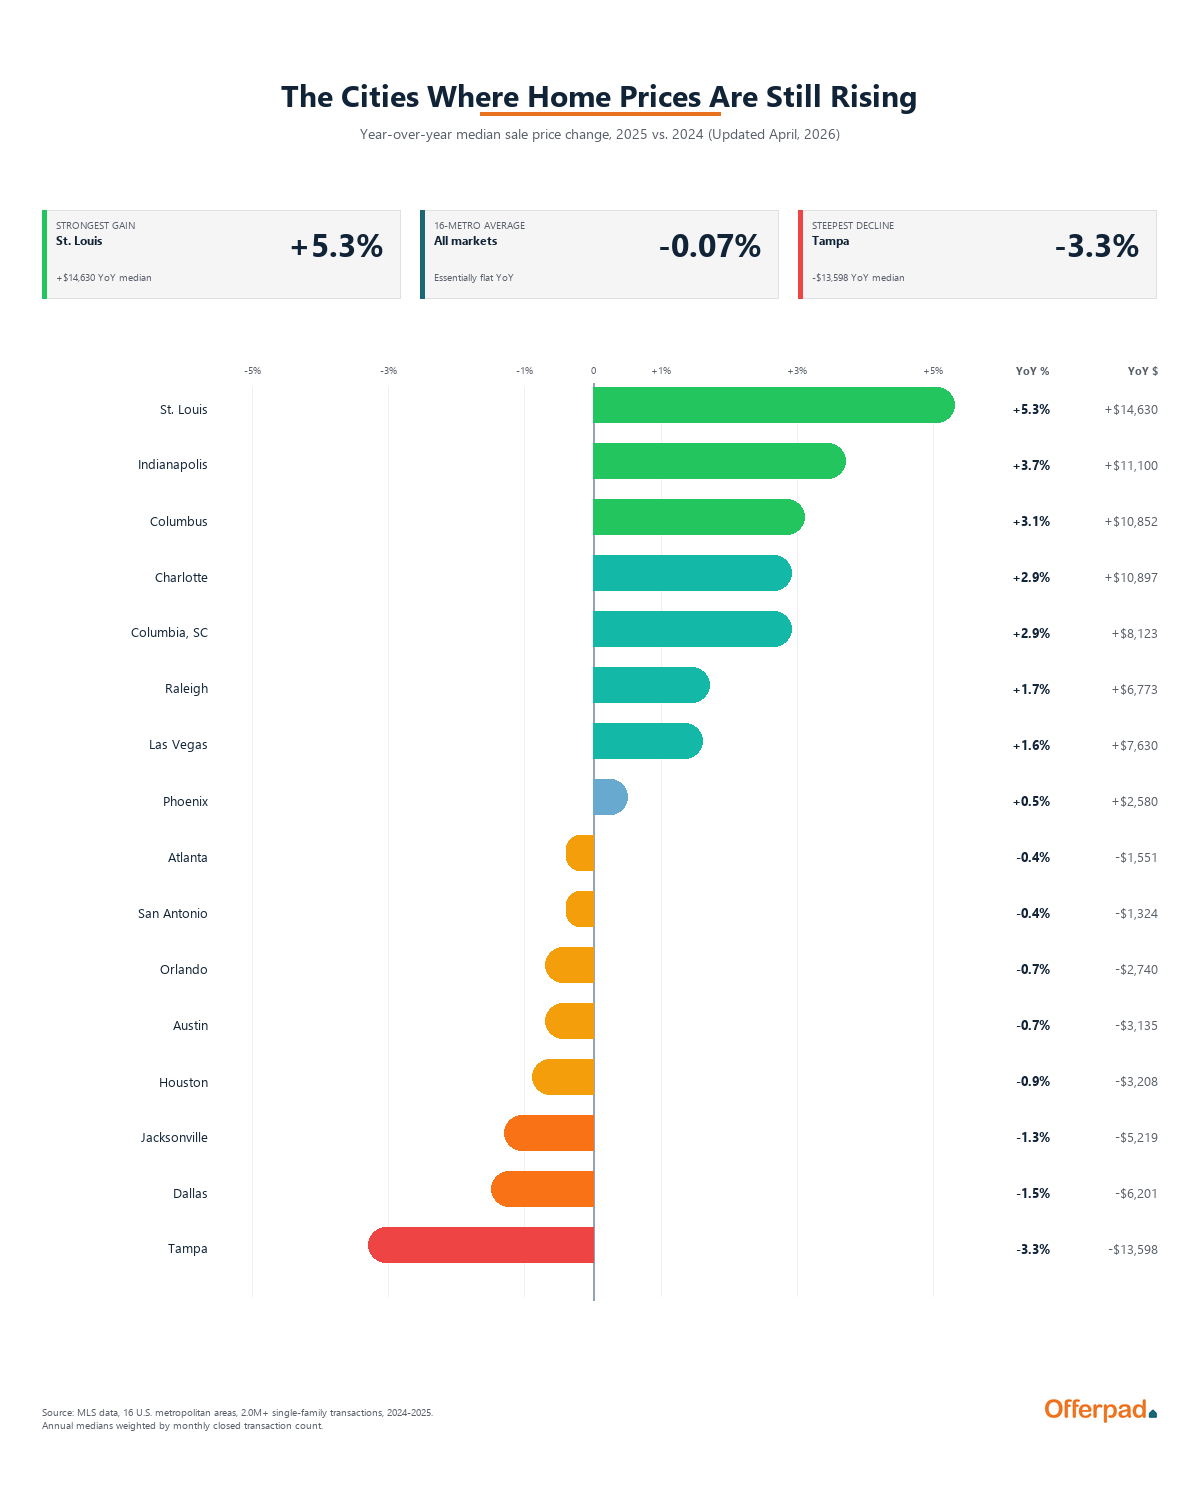
An analysis by Offerpad of aggregated multiple listing service (MLS) data covering more than 2.0 million single-family home transactions across 16 metropolitan areas in 2024 and 2025 found seven markets that posted year-over-year (YoY) median sale price gains of 1.5 percent or more, while six markets posted declines. The widest spread, between St. Louis at the top and Tampa at the bottom, was 8.7 percentage points. Underneath the flat national surface, the country was sorting itself into resilient markets and correcting markets.
Where Are Home Prices Rising the Most in 2025?
The seven metros in this analysis with positive YoY median sale price growth in 2025, ranked from largest to smallest gain:
- St. Louis posted +5.3 percent ($274,964 to $289,593).
- Indianapolis posted +3.7 percent ($300,476 to $311,576).
- Columbus, OH posted +3.1 percent ($352,419 to $363,271).
- Charlotte posted +2.9 percent ($374,902 to $385,799).
- Columbia, SC posted +2.9 percent ($283,548 to $291,671).
- Raleigh posted +1.7 percent ($405,440 to $412,213).
- Las Vegas posted +1.6 percent ($475,516 to $483,146).
Five of these seven metros began 2024 with median sale prices below $400,000, keeping monthly payments within reach for a buyer financing at 6.5 to 7 percent. Building-permit data from the U.S. Census Bureau Building Permits Survey (https://www.census.gov/construction/bps/) shows new single-family construction in the Midwestern markets has historically run below the national pace, keeping inventory tight relative to demand.
Full 16-Market Ranking: Year-Over-Year Median Sale Price (2025 vs. 2024)
The table below ranks all 16 metros analyzed in this study.
| Rank | Market | 2024 Median | 2025 Median | YoY Change ($) | YoY Change (%) |
|---|---|---|---|---|---|
| 1 | St. Louis | $274,964 | $289,593 | +$14,630 | +5.3% |
| 2 | Indianapolis | $300,476 | $311,576 | +$11,100 | +3.7% |
| 3 | Columbus | $352,419 | $363,271 | +$10,852 | +3.1% |
| 4 | Charlotte | $374,902 | $385,799 | +$10,897 | +2.9% |
| 5 | Columbia, SC | $283,548 | $291,671 | +$8,123 | +2.9% |
| 6 | Raleigh | $405,440 | $412,213 | +$6,773 | +1.7% |
| 7 | Las Vegas | $475,516 | $483,146 | +$7,630 | +1.6% |
| 8 | Phoenix | $478,798 | $481,379 | +$2,580 | +0.5% |
| 9 | Atlanta | $424,296 | $422,745 | -$1,551 | -0.4% |
| 10 | San Antonio | $312,910 | $311,586 | -$1,324 | -0.4% |
| 11 | Orlando | $405,999 | $403,259 | -$2,740 | -0.7% |
| 12 | Austin | $422,950 | $419,815 | -$3,135 | -0.7% |
| 13 | Houston | $344,218 | $341,011 | -$3,208 | -0.9% |
| 14 | Jacksonville | $400,185 | $394,966 | -$5,219 | -1.3% |
| 15 | Dallas | $412,964 | $406,763 | -$6,201 | -1.5% |
| 16 | Tampa | $407,470 | $393,872 | -$13,598 | -3.3% |
Source: Aggregated MLS data, 2024 and 2025 closed single-family transactions, 16 metropolitan areas. Annual medians weighted by monthly closed transaction count.
The 16-market weighted-average median sat at $390,244 in 2024 and $389,989 in 2025, a change of less than one-tenth of one percent. That aggregate is consistent with the FHFA and Case-Shiller national readings. But the same flat aggregate hides an 8.7-percentage-point spread between the strongest and weakest market.
The Quiet Comeback of the Affordable City
The story of 2025’s resilient housing markets is the story of cities that never went viral.
St. Louis. Indianapolis. Columbus. Charlotte. Columbia, South Carolina. None drew floods of remote workers from California or New York during the pandemic. None topped most-searched lists on national real estate websites. They did not produce the eye-catching 30 percent and 40 percent price gains of 2020 to 2022 that made Austin and Tampa household names.
Now they are the markets where prices kept rising.
St. Louis led the analysis at 5.3 percent annual median price growth, the largest gain among the 16 metros studied and 1.6 percentage points above the next-closest market. For a median seller, that is roughly $14,600 of additional value baked into the same property over twelve months.
The pattern in St. Louis is what an appraiser would call boring, and that is the point. The city’s homes were already priced low enough that even seven-percent mortgage rates did not break buyer affordability. New construction lagged behind population. Local employment grew at a modest but steady pace. None of the conditions for a price spike were present, but neither were the conditions for a price drop. What St. Louis offered was a price floor.
Indianapolis followed at 3.7 percent. Columbus, Ohio, gained 3.1 percent, supported by an expanding semiconductor and logistics employment base in central Ohio. Charlotte and Columbia, SC, both rose around 2.9 percent, continuing a Carolinas migration story that has now run long enough to qualify as structural rather than seasonal.
Raleigh and Las Vegas closed out the seven-market gainer list with smaller but positive changes (1.7 percent and 1.6 percent, respectively). Las Vegas is the surprise on that list. The market had been visibly cooling through 2023 and early 2024, and a return to even modest appreciation suggests local demand has stabilized.
Phoenix at the Hinge
Phoenix is the most informative market to watch in 2026, in part because it sits exactly on the breakeven line.
Median sale prices grew 0.5 percent year over year, the smallest change in the dataset. The Phoenix story since 2022 has been one of testing whether pandemic-era price gains would hold or unwind. As of 2025, the answer is neither: they are sticking, but not adding.
Phoenix is also one of two markets where headline median price and median price per square foot point in different directions. Median sale prices rose 0.5 percent. Median price per square foot fell 0.9 percent. The gap suggests larger homes made up a slightly bigger share of 2025 closings than in 2024, which is a mix-of-homes-sold effect rather than underlying appreciation. On a price-per-square-foot basis, Phoenix should be read as flat-to-slightly-down, not flat-to-slightly-up.
Where Are Home Prices Falling?
Six markets posted YoY median sale price declines in 2025. They cluster in three categories.
Pandemic boomtowns, still correcting. Austin (-0.7 percent), Dallas (-1.5 percent), San Antonio (-0.4 percent), and Houston (-0.9 percent) continue to give back gains made during 2020 to 2022. Three of the four (Austin, Dallas, and San Antonio) ended 2025 with median prices below their 2023 levels. Pandemic-era buyers paid prices that assumed continued tech-sector hiring, continued migration from California, and continued inventory shortages. By 2025, all three of those drivers had moderated. Hiring slowed. Net migration eased. Builders, especially in Austin, finished projects that had been in the pipeline for years.
Florida insurance shock. Tampa fell 3.3 percent, the steepest decline in the dataset. Jacksonville fell 1.3 percent. Orlando fell 0.7 percent. Florida property insurance premiums climbed 40 percent or more between 2022 and 2024, according to the Insurance Information Institute (https://www.iii.org/article/insurance-fact-book). When insurance jumps from $2,000 to $5,000 or more a year, the buyer’s monthly housing cost rises regardless of the asking price. Buyers compensate by bidding less for the underlying home, which compresses sale prices.
Atlanta in the middle. Atlanta’s 0.4 percent decline is the smallest negative change in the dataset, reflecting competing pressures rather than a single dominant trend. Atlanta sits at the boundary between the Texas correction and the Carolinas appreciation, and its outcome reflects both forces.
Three-Year View: Cumulative Home Price Change 2023 to 2025
A single-year reading can obscure longer trends. The table below shows weighted-average median sale prices for each market in 2023, 2024, and 2025, along with the cumulative change.
| Rank | Market | 2023 Median | 2024 Median | 2025 Median | 3-Year Change |
|---|---|---|---|---|---|
| 1 | St. Louis | $261,065 | $274,964 | $289,593 | +10.9% |
| 2 | Las Vegas | $442,529 | $475,516 | $483,146 | +9.2% |
| 3 | Columbus | $335,627 | $352,419 | $363,271 | +8.2% |
| 4 | Indianapolis | $289,091 | $300,476 | $311,576 | +7.8% |
| 5 | Charlotte | $359,751 | $374,902 | $385,799 | +7.2% |
| 6 | Phoenix | $460,623 | $478,798 | $481,379 | +4.5% |
| 7 | Columbia, SC | $279,123 | $283,548 | $291,671 | +4.5% |
| 8 | Atlanta | $409,108 | $424,296 | $422,745 | +3.3% |
| 9 | Jacksonville | $384,443 | $400,185 | $394,966 | +2.7% |
| 10 | Raleigh | $401,731 | $405,440 | $412,213 | +2.6% |
| 11 | Orlando | $394,838 | $405,999 | $403,259 | +2.1% |
| 12 | Houston | $339,493 | $344,218 | $341,011 | +0.4% |
| 13 | Dallas | $408,635 | $412,964 | $406,763 | -0.5% |
| 14 | Austin | $426,605 | $422,950 | $419,815 | -1.6% |
| 15 | San Antonio | $320,105 | $312,910 | $311,586 | -2.7% |
| 16 | Tampa | $407,468 | $407,470 | $393,872 | -3.3% |
Source: Aggregated MLS data, 2023 to 2025 closed single-family transactions, 16 metropolitan areas.
St. Louis leads the three-year leaderboard at 10.9 percent cumulative growth, the only market in this analysis to clear ten percent over the stretch. Las Vegas takes second at 9.2 percent. Columbus, Indianapolis, and Charlotte round out the top five.
The bottom of the table tells the harder story. Five markets ended 2025 with median prices at or below their 2023 starting points: Dallas, Austin, San Antonio, Tampa, and (with a small 0.4 percent gain) Houston. These are not collapses. They are sustained pressure on the sellers who bought in 2021 and 2022 expecting their homes to continue gaining value.
For the country as a whole, three years of housing market churn produced almost no net change in the 16-market weighted average. For an individual seller in St. Louis, those three years added about $28,500 to the local median. For an individual seller in Tampa, the same three years took back about $13,600.
Q1 2026: Is the Trend Continuing?
The first quarter of 2026 gives a directional read on whether the 2025 patterns hold into the new year. Q1 figures are partial; the bulk of any year’s home sales close in April through August, when buyer competition peaks. But the Q1 read is a useful early signal.
| Market | Q1 2025 Median | Q1 2026 Median | YoY Change (%) |
|---|---|---|---|
| St. Louis | $266,292 | $281,425 | +5.7% |
| Columbus | $346,248 | $359,864 | +3.9% |
| Jacksonville | $385,999 | $392,882 | +1.8% |
| Columbia, SC | $283,604 | $288,342 | +1.7% |
| Indianapolis | $296,975 | $299,264 | +0.8% |
| San Antonio | $303,959 | $306,139 | +0.7% |
| Atlanta | $409,895 | $412,084 | +0.5% |
| Charlotte | $373,332 | $374,692 | +0.4% |
| Orlando | $400,352 | $401,612 | +0.3% |
| Raleigh | $399,295 | $397,734 | -0.4% |
| Tampa | $395,506 | $393,397 | -0.5% |
| Houston | $337,151 | $333,381 | -1.1% |
| Las Vegas | $486,609 | $480,164 | -1.3% |
| Phoenix | $490,410 | $483,746 | -1.4% |
| Dallas | $405,619 | $395,140 | -2.6% |
| Austin | $414,711 | $402,667 | -2.9% |
Source: Aggregated MLS data, January through March 2025 vs. January through March 2026, 16 metropolitan areas.
Most of the 2025 storylines hold. St. Louis remains the strongest market and accelerated to 5.7 percent year-over-year growth in Q1 2026. Columbus also accelerated. Texas continued to soften, with Austin and Dallas posting the largest YoY declines. Tampa held its decline at a smaller magnitude.
Two markets switched direction. Jacksonville moved from a 1.3 percent full-year 2025 decline to a 1.8 percent Q1 2026 gain, an early sign that the Florida correction is uneven across metros. Las Vegas moved the other way, from a 1.6 percent full-year 2025 gain to a 1.3 percent Q1 2026 decline.
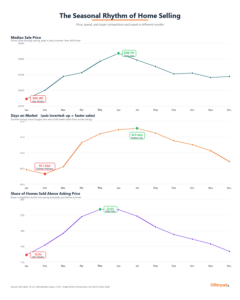
Median Sale Price vs. Price Per Square Foot: A Sanity Check
Median sale price can shift because the mix of homes sold changes (more luxury closings versus more starter-home closings) as much as because home values themselves changed. Median price per square foot strips out part of that mix-of-homes effect.
For 14 of the 16 markets in this analysis, the YoY direction of median sale price and median price per square foot agree, confirming the headline rankings. The two exceptions are Phoenix (median sale price up 0.5 percent, price per square foot down 0.9 percent) and Raleigh (median sale price up 1.7 percent, price per square foot up only 0.1 percent). Both should be read as essentially flat on an underlying-appreciation basis.
St. Louis leads on both measures (+5.3 percent on median sale price, +3.6 percent on median price per square foot). Tampa trails on both (-3.3 percent on median sale price, -3.6 percent on median price per square foot). Where the two measures agree, the headline ranking is reliable. Where they disagree, the narrative shifts to the price-per-square-foot reading.
Why the National Headline Misses the Picture
The S&P CoreLogic Case-Shiller National Home Price Index and the FHFA House Price Index both showed 2025 as one of the slowest years for home price appreciation since the housing recovery began. National median existing-home sale price data from the National Association of Realtors tells the same story.
But “flat” at the national level can mean very different things at the local level.
It can mean a market like St. Louis, where prices grew steadily and the median seller in 2025 had a real local gain of about $14,600.
It can mean a market like Tampa, where the headline price fell, and the median seller saw real local erosion of about $13,600.
It can mean a market like Phoenix, where the headline barely moved at all.
The national average is, in 2025, an unusually poor proxy for what individual sellers experienced.
What the Numbers Show for the 2026 Housing Market
The data shows a clear segmentation in the U.S. housing market.
Affordable Midwestern and inland Southern markets continue to absorb buyer demand. St. Louis, Indianapolis, Columbus, Charlotte, and Columbia, SC, all share lower price floors that have proven durable through the higher-rate environment. The 5.3-percent gain in St. Louis is the standout result of 2025.
Pandemic boomtowns continue to give back gains. Austin, Dallas, San Antonio, and Tampa show three-year price levels at or below their 2023 starting points. The correction is uneven but persistent.
Florida is not a single story. Tampa is correcting sharply. Jacksonville is mixed, with a full-year 2025 decline followed by a Q1 2026 gain. Orlando is roughly flat. Insurance cost pressure affects all three but does not produce identical outcomes.
For homeowners assessing whether their property gained or lost value last year, the question is not what the national index did but which of the sixteen local stories applies to their city.
Methodology
This analysis is based on aggregated multiple listing service (MLS) data for closed single-family home transactions from January 2023 through March 2026 across 16 metropolitan markets: Atlanta, Austin, Charlotte, Columbia (SC), Columbus (OH), Dallas, Houston, Indianapolis, Jacksonville, Las Vegas, Orlando, Phoenix, Raleigh, St. Louis, San Antonio, and Tampa. The MLS data was sourced and prepared by the Offerpad Research Team.
All statistics represent market-wide transaction data, not Offerpad-specific transactions. Annual medians are calculated by weighting each month’s reported median sale price by that month’s closed transaction count, then averaging across months in the year. Year-over-year comparisons use full calendar years where available (2023, 2024, and 2025). The Q1 2026 directional comparison uses January through March 2026 against January through March 2025.
The dataset includes more than 2.0 million single-family transactions across the 16 metros for 2024 and 2025 combined. Coverage note: January, February, and March are represented by four years of data (2023 through 2026); April through December are represented by three years (2023 through 2025). Year-over-year and three-year comparisons use full-calendar-year data only and are not affected by this asymmetry.
Median price per square foot is referenced in the analysis as a sanity check on whether headline median changes reflect underlying appreciation or shifts in the mix of homes sold. For 14 of the 16 markets, the two measures agree in direction. Phoenix and Raleigh are the two exceptions and are noted in the analysis above.
Supporting national data is drawn from the S&P CoreLogic Case-Shiller U.S. National Home Price Index, the Federal Housing Finance Agency House Price Index, the National Association of Realtors existing-home sales reports, and the U.S. Census Bureau Building Permits Survey, all linked inline above. Florida insurance-cost data is from the Insurance Information Institute. Information is deemed reliable but not guaranteed.