By Otto Acosta, Offerpad Research Team
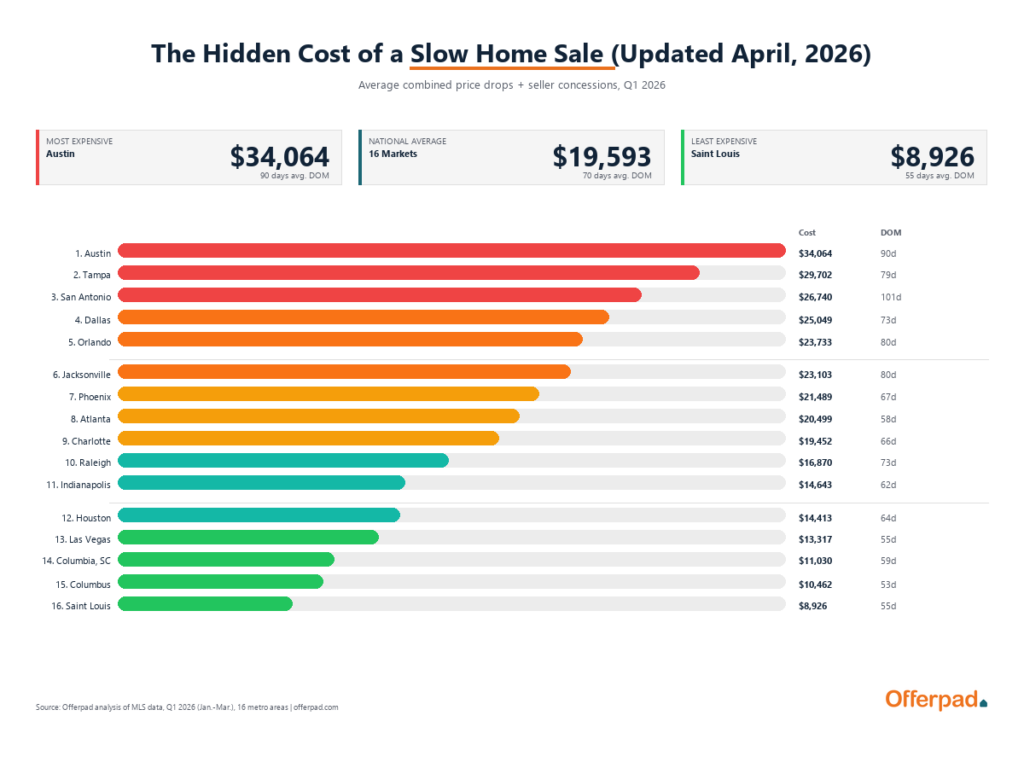
A home seller in Austin who listed in January 2026 and waited three months to close gave up, on average, $34,064. That is the combined toll of price reductions and buyer concessions, neither of which the seller planned for when the listing went live.
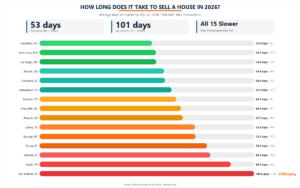
In San Antonio, the number was $26,740, but the wait was longer: 101 days, more than three months of mortgage payments, utility bills, and lawn maintenance before the deal closed. In Saint Louis, the total was $8,926. Same country, same quarter, same housing market by name, but not by experience.
Across 16 major U.S. markets, Offerpad analyzed more than 2.1 million single-family home transactions from January 2023 through March 2026 and found that the financial penalty for a slow sale is large, growing, and varies by a factor of nearly four depending on where the home sits.

The Two Ways a Slow Sale Costs Sellers
When a home lingers on the market, the cost shows up in two places.
The first is the price reduction. After weeks without an acceptable offer, the seller lowers the asking price. Across the 16 markets in this analysis, the average price drop in Q1 2026 was $16,136. That is the gap between the first listed price and the eventual sale price, as recorded in MLS data.
The second is seller concessions: closing cost credits, repair credits, and other incentives the seller agrees to pay from the proceeds. These do not appear in listing price history. A home might sell for $400,000, matching the asking price, but the seller might hand back $5,000 at closing for the buyer’s title insurance, inspection repairs, or rate buydown. The average concession in Q1 2026 was $3,458 across the markets where data was available.
Together, these two costs averaged $19,593 per transaction in Q1 2026. That is 5.2% of the typical sale price, lost before the seller pays agent commissions, title fees, or moving expenses.
The Cost of Selling a House, Ranked by Market
The table below ranks all 16 markets by their combined cost of selling in Q1 2026, measured as the sum of the average price reduction and average seller concessions.
| Rank | Market | Avg. Price Drop | Avg. Concessions | Combined Cost | Avg. DOM | % of Sale Price |
|---|---|---|---|---|---|---|
| 1 | Austin | $29,054 | $5,010 | $34,064 | 90 days | 8.4% |
| 2 | Tampa | $24,228 | $5,474 | $29,702 | 79 days | 7.6% |
| 3 | San Antonio | $20,345 | $6,395 | $26,740 | 101 days | 8.7% |
| 4 | Dallas | $19,708 | $5,341 | $25,049 | 73 days | 6.3% |
| 5 | Orlando | $19,025 | $4,708 | $23,733 | 80 days | 5.9% |
| 6 | Jacksonville | $19,067 | $4,037 | $23,103 | 80 days | 5.9% |
| 7 | Phoenix | $17,747 | $3,742 | $21,489 | 67 days | 4.4% |
| 8 | Atlanta | $13,879 | $6,621 | $20,499 | 58 days | 5.0% |
| 9 | Charlotte | $15,137 | $4,315 | $19,452 | 66 days | 5.2% |
| 10 | Raleigh | $13,717 | $3,153 | $16,870 | 73 days | 4.2% |
| 11 | Indianapolis | $11,924 | $2,719 | $14,643 | 62 days | 4.9% |
| 12 | Houston | $14,108 | $306 | $14,413 | 64 days | 4.3% |
| 13 | Las Vegas | $13,317 | $0 | $13,317 | 55 days | 2.8% |
| 14 | Columbia, SC | $9,462 | $1,568 | $11,030 | 59 days | 3.8% |
| 15 | Columbus | $10,462 | N/A | $10,462 | 53 days | 2.9% |
| 16 | Saint Louis | $6,993 | $1,933 | $8,926 | 55 days | 3.2% |
Source: Offerpad analysis of MLS data, Q1 2026 (Jan.-Mar.), 16 metro areas. Columbus concessions data not available in source. Houston and Las Vegas report minimal or zero concessions in MLS data, likely reflecting regional reporting differences rather than true zero concessions.
Texas dominates the top of this list. Three of the four most expensive markets (Austin, San Antonio, Dallas) are in Texas. These are markets that boomed during the pandemic, attracted national attention and new supply, and are now adjusting. The cost of that adjustment falls on sellers.
San Antonio stands out not just for its total cost but for its timeline: 101 days on market in Q1 2026, the only market in the dataset above 100 days. When measured as a percentage of the median sale price, San Antonio (8.7%) overtakes Austin (8.4%) as the most expensive market to sell in. A San Antonio seller with a $307,000 home loses nearly nine cents of every dollar to price drops and concessions before paying any other closing costs.
The Concession Costs Nobody Sees
Price reductions are public. They show up in listing history, on real estate websites, and in every market report. Concessions are invisible until closing day.
In six markets, concessions now add more than $4,000 to the cost of selling:
| Market | Avg. Concessions (Q1 2026) | Concessions as % of Price Drop |
|---|---|---|
| Atlanta | $6,621 | 48% |
| San Antonio | $6,395 | 31% |
| Tampa | $5,474 | 23% |
| Dallas | $5,341 | 27% |
| Austin | $5,010 | 17% |
| Orlando | $4,708 | 25% |
Source: Offerpad analysis of MLS data, Q1 2026 (Jan.-Mar.). Concessions include closing cost credits, repair allowances, rate buydowns, and home warranty payments.
Atlanta stands apart. Its average concession amount ($6,621) equals nearly half of its average price reduction ($13,879). Atlanta sellers lose almost as much through behind-the-scenes concessions as they do through public price cuts. Atlanta buyers appear to negotiate hard on both fronts, requesting lower prices and asking for closing cost assistance on top.
And the trend is accelerating. Atlanta concessions have risen 52% since January 2023, from $4,480 to $6,794 per transaction. That growth has been steady: up in almost every quarter, regardless of seasonal shifts.
San Antonio’s concession story is more sudden. Through the first half of 2025, average concessions hovered around $3,400. By October, they had jumped to $4,898. By December, $6,117. By March 2026, $6,874. This looks less like a gradual shift and more like a market that reached a tipping point, where sellers who had been resisting concessions started saying yes.
For sellers weighing their options in Atlanta or San Antonio, these concession trends mean a home might sell near asking price but still leave thousands on the table at closing.
Where Selling Costs Are Rising Fastest
Between Q1 2025 and Q1 2026, 15 of 16 markets saw combined selling costs increase. Only Saint Louis declined, and by just $93.
Markets With the Steepest Year-Over-Year Increases
| Market | Q1 2025 | Q1 2026 | Dollar Increase | % Increase |
|---|---|---|---|---|
| San Antonio | $19,115 | $26,740 | +$7,626 | +39.9% |
| Las Vegas | $10,591 | $13,317 | +$2,726 | +25.7% |
| Columbia, SC | $8,884 | $11,030 | +$2,146 | +24.2% |
| Houston | $11,751 | $14,413 | +$2,662 | +22.7% |
| Indianapolis | $11,970 | $14,643 | +$2,674 | +22.3% |
| Dallas | $20,848 | $25,049 | +$4,202 | +20.2% |
| Columbus | $8,710 | $10,462 | +$1,752 | +20.1% |
San Antonio’s 39.9% year-over-year jump is the largest in the dataset by a wide margin. That increase was driven by two forces moving in the same direction: price reductions climbed as inventory grew and buyers gained leverage, while concessions roughly doubled from $3,200 to $6,400. Days on market rose from 86 to 101.
Markets With the Smallest Increases (or a Decline)
| Market | Q1 2025 | Q1 2026 | Dollar Increase | % Increase |
|---|---|---|---|---|
| Saint Louis | $9,019 | $8,926 | -$93 | -1.0% |
| Tampa | $28,465 | $29,702 | +$1,238 | +4.3% |
| Phoenix | $20,211 | $21,489 | +$1,278 | +6.3% |
| Austin | $31,435 | $34,064 | +$2,630 | +8.4% |
Source: Offerpad analysis of MLS data, Q1 2025 vs. Q1 2026, 16 metro areas.
Tampa and Austin’s slow growth rates are somewhat misleading. Their costs were already among the highest in the dataset. Austin’s 8.4% increase on a base of $31,435 still represents $2,630 in additional cost per transaction, more than the total increase in Columbus or Columbia.
The Longer View: How Selling Costs Have Changed Since 2023
Over the full three-year window from Q1 2023 to Q1 2026, the 16 markets followed one of three trajectories.
Markets recovering from a worse peak. Austin ($40,199 to $34,064), Phoenix ($35,445 to $21,489), Las Vegas ($30,164 to $13,317), and Jacksonville ($24,905 to $23,103). These markets experienced the sharpest post-pandemic corrections and have moderated, though costs are now rising again. Las Vegas saw the most improvement: a $16,847 decline over three years.
Markets on a steady climb. Tampa ($26,518 to $29,702), Charlotte ($16,398 to $19,452), Orlando ($20,771 to $23,733), Columbus ($7,298 to $10,462), and Columbia ($8,600 to $11,030). Costs rose in three or more consecutive Q1 periods in each of these markets. Tampa’s trajectory is the most consistent and the most worrying: it is approaching $30,000 per transaction with no sign of leveling off.
Markets following a V-shaped path. Dallas ($23,164 to $17,505 to $25,049), Atlanta ($18,095 to $14,492 to $20,499), Raleigh ($14,914 to $9,535 to $16,870), and Indianapolis ($12,418 to $11,442 to $14,643). These markets dipped in 2024 then rebounded past their 2023 levels. Dallas is now $1,885 above where it started three years ago.
Does Time on Market Predict the Cost of Selling?
Across all 624 market-month observations in the dataset, the correlation between average days on market and combined selling cost is 0.77. That is a strong positive relationship: when homes sit longer, sellers lose more money.
The strength of that relationship varies:
| Market | DOM-Cost Correlation (r) | Interpretation |
|---|---|---|
| Orlando | 0.84 | Very strong |
| Tampa | 0.83 | Very strong |
| Atlanta | 0.83 | Very strong |
| Dallas | 0.83 | Very strong |
| Charlotte | 0.81 | Very strong |
| Jacksonville | 0.81 | Very strong |
| Raleigh | 0.80 | Strong |
| Las Vegas | 0.77 | Strong |
| Houston | 0.72 | Strong |
| Phoenix | 0.68 | Moderate |
| Indianapolis | 0.64 | Moderate |
| Austin | 0.62 | Moderate |
| San Antonio | 0.62 | Moderate |
| Columbia, SC | 0.61 | Moderate |
| Columbus | 0.59 | Moderate |
| Saint Louis | 0.29 | Weak |
Source: Offerpad analysis of MLS data, Jan. 2023 – Mar. 2026. Pearson correlation between average DOM and combined cost (price drops + concessions) for each market across all months.
In Orlando, Tampa, Atlanta, and Dallas, time on market functions almost as a cost meter. Each additional week a home sits corresponds to a measurable increase in price reductions and concessions.
Saint Louis is the outlier with a correlation of just 0.29. The likely reason is that costs there are so low in absolute terms that the statistical relationship breaks down. The difference between a slow and fast sale in Saint Louis is small enough that other factors dominate.
A previous Offerpad analysis of how long it takes to sell a home found rising DOM trends in most of these same markets. If that trend continues, the cost figures here are likely to climb further.
What Each Day on the Market Costs Sellers
Dividing each market’s combined cost by its average days on market produces a rough cost-per-day figure. This is a simplified average, not a linear daily rate (costs tend to accelerate rather than accumulate evenly). But it shows relative urgency across markets.
| Rank | Market | Cost Per Day | Combined Cost | Avg. DOM |
|---|---|---|---|---|
| 1 | Austin | $380/day | $34,064 | 90 days |
| 2 | Tampa | $378/day | $29,702 | 79 days |
| 3 | Atlanta | $351/day | $20,499 | 58 days |
| 4 | Dallas | $343/day | $25,049 | 73 days |
| 5 | Phoenix | $320/day | $21,489 | 67 days |
| 6 | Orlando | $296/day | $23,733 | 80 days |
| 7 | Charlotte | $293/day | $19,452 | 66 days |
| 8 | Jacksonville | $290/day | $23,103 | 80 days |
| 9 | San Antonio | $266/day | $26,740 | 101 days |
| 10 | Las Vegas | $243/day | $13,317 | 55 days |
| 11 | Indianapolis | $237/day | $14,643 | 62 days |
| 12 | Raleigh | $231/day | $16,870 | 73 days |
| 13 | Houston | $224/day | $14,413 | 64 days |
| 14 | Columbus | $198/day | $10,462 | 53 days |
| 15 | Columbia, SC | $187/day | $11,030 | 59 days |
| 16 | Saint Louis | $163/day | $8,926 | 55 days |
Source: Offerpad analysis of MLS data, Q1 2026, 16 metro areas. These figures do not include carrying costs (mortgage, insurance, HOA, property taxes), which add to the financial burden of a longer timeline.
Austin and Tampa are nearly identical in cost per day ($380 vs. $378), but they arrive at that figure through different paths. Austin’s cost comes from very large price reductions ($29,054 average) spread over 90 days. Tampa’s comes from a slightly smaller price reduction ($24,228) paired with significant concessions ($5,474), over 79 days.
San Antonio is instructive in the opposite direction. Despite having the highest combined cost as a percentage of sale price (8.7%), its cost per day ($266) ranks only 9th. The reason: San Antonio homes simply take so long to sell (101 days) that the cost spreads over more calendar days. The total cost is steep, but it accumulates gradually.
When the Cost of Selling Is Highest: Seasonal Patterns
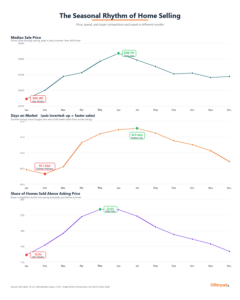
The cost of selling follows the calendar. The most expensive month to sell, measured by combined price drops and concessions, is January. The cheapest is June. The gap between them is $5,818.
| Month | Avg. Combined Cost | vs. June (Cheapest) |
|---|---|---|
| January | $19,939 | +$5,818 (+41%) |
| February | $17,911 | +$3,790 (+27%) |
| March | $16,370 | +$2,249 (+16%) |
| April | $14,676 | +$555 (+4%) |
| May | $14,162 | +$41 (flat) |
| June | $14,121 | Baseline |
| July | $15,040 | +$919 (+7%) |
| August | $16,754 | +$2,633 (+19%) |
| September | $17,174 | +$3,053 (+22%) |
| October | $17,280 | +$3,159 (+22%) |
| November | $18,168 | +$4,047 (+29%) |
| December | $19,435 | +$5,314 (+38%) |
Source: Offerpad analysis of MLS data, Jan. 2023 – Mar. 2026, 16 metro areas, all available months. Jan.-Mar. figures include four years of data (2023-2026); Apr.-Dec. include three years (2023-2025).
The pattern makes sense in context. Winter sellers face fewer buyers, longer listing times, and weaker offers. By the time spring demand picks up, the damage is done: price reductions have already been posted and concessions agreed to. Homes that close in June were typically listed in April or May, when buyer competition was building. Homes that close in January were typically listed in November, when the market was winding down.
This seasonal cost curve mirrors what a related Offerpad analysis of the best and worst months to sell a home found: the months with the highest sale prices and fastest sales are the same months when the combined cost of price drops and concessions is lowest. The April-through-July window stands out as the most cost-effective selling season.
What the Numbers Show for Sellers in 2026
The data points to several patterns worth watching.
Every market except Saint Louis got more expensive for sellers in the past year. The 16-market average combined cost rose from roughly $17,000 in Q1 2025 to $19,593 in Q1 2026. This is not a single-market story; it is a broad shift.
The gap between the most and least expensive markets is large, and it is not just a matter of home prices. San Antonio homes have lower median prices than Phoenix, Las Vegas, or Austin, yet San Antonio sellers lose a higher share of their sale price to the cost of a slow sale. Market dynamics, inventory levels, and buyer leverage vary by city in ways that home values alone do not capture.
Concessions are a growing share of the cost in many markets. In Atlanta, San Antonio, Tampa, Dallas, and Orlando, concessions now add $4,700 to $6,600 per transaction. This is money that does not show up in listing price changes but reduces what the seller takes home at closing.
For sellers exploring options in Austin, Tampa, Dallas, or Orlando, the data shows a cost structure that extends well beyond agent commissions. For those in more affordable markets like Charlotte, Jacksonville, or Indianapolis, the numbers are lower but trending in the same direction.
Methodology
This analysis is based on aggregated multiple listing service data for single-family home transactions from January 2023 through March 2026 across 16 metropolitan markets where Offerpad operates: Atlanta, Austin, Charlotte, Columbia (SC), Columbus, Dallas, Houston, Indianapolis, Jacksonville, Las Vegas, Orlando, Phoenix, Raleigh, Saint Louis, San Antonio, and Tampa.
“Combined cost” is defined as the sum of the average price reduction (the difference between the original listing price and the final sale price for homes that sold below their initial asking price) and the average seller concessions (closing cost credits, repair credits, and other seller-paid buyer incentives recorded in MLS data).
All statistics represent market-wide transaction data, not Offerpad-specific transactions. Concessions data for Columbus is not available in the source data. Houston and Las Vegas report minimal concessions, which may reflect regional MLS reporting practices rather than actual market conditions.
January through March figures reflect four years of data (2023-2026). April through December figures reflect three years (2023-2025). Year-over-year and trend comparisons use consistent time periods.
Information is deemed reliable but not guaranteed.