By Otto Acosta, Offerpad Research Team
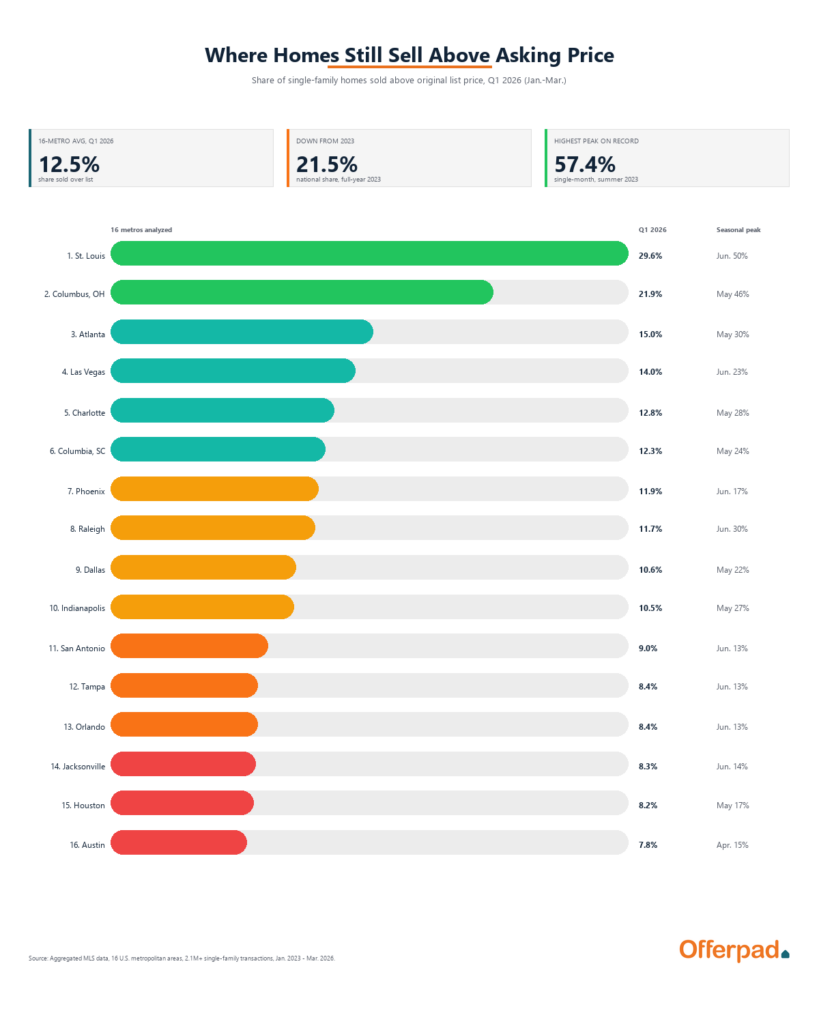
A homeowner in St. Louis who listed in June 2023 had better-than-even odds of selling for more than the asking price. Roughly six in ten transactions that month closed above the original list. Three years later, in St. Louis, the figure is still close to one in three. In Austin, where homes a few years ago routinely drew five and ten offers, fewer than one in twelve sellers now gets above asking.
That is the gap between two American housing markets in 2026, both inside the same country, the same broader economy, and the same set of national mortgage rates.
An Offerpad analysis of aggregated multiple listing service (MLS) data covering more than 2.1 million single-family home transactions across 16 metropolitan areas from January 2023 through March 2026 maps where above-list sales remain frequent, where they have effectively ended, and how seasonally the pattern shifts.
Multiple national datasets point in the same direction. The National Association of Realtors’ February 2026 Existing-Home Sales report shows U.S. inventory at 3.5 months of supply, more than double the 1.7-month low of 2022, with the median existing-home sale price up 3.0% year over year (NAR). Redfin’s monthly housing data shows the share of homes selling over list price nationally has fallen from above 50% in mid-2022 to roughly 24% in early 2026 (Redfin). Realtor.com’s market trends reporting shows similar inventory rebuilding across the largest 50 metros (Realtor.com Research). Together, those sources describe a market that has shifted toward buyers across most of the country, with isolated holdouts.
But “most of the country” is not “all of it.” Two markets still feel like 2022.

Where Homes Still Sell Above Asking Price in 2026
In Q1 2026, the share of single-family homes selling above the original list price ranged from 7.8% in Austin to 29.6% in St. Louis. That is nearly a 4-to-1 gap between the coolest and the hottest market in the same quarter.
Q1 2026 Standings: Share of Homes Sold Above Original List Price
| Rank | Market | Q1 2026 Avg. % Over List | Tier |
|---|---|---|---|
| 1 | St. Louis | 29.6% | Hot |
| 2 | Columbus, OH | 21.9% | Hot |
| 3 | Atlanta | 15.0% | Warm |
| 4 | Las Vegas | 14.0% | Warm |
| 5 | Charlotte | 12.8% | Warm |
| 6 | Columbia, SC | 12.3% | Warm |
| 7 | Phoenix | 11.9% | Average |
| 8 | Raleigh | 11.7% | Average |
| 9 | Dallas | 10.6% | Average |
| 10 | Indianapolis | 10.5% | Average |
| 11 | San Antonio | 9.0% | Cooled |
| 12 | Tampa | 8.4% | Cooled |
| 13 | Orlando | 8.4% | Cooled |
| 14 | Jacksonville | 8.3% | Cooled |
| 15 | Houston | 8.2% | Cooled |
| 16 | Austin | 7.8% | Cooled |
Source: An analysis of aggregated MLS data, Jan. through Mar. 2026, 16 U.S. metropolitan areas.
Two markets stand apart from everything else. St. Louis sits in a category of its own at 29.6%. Columbus, Ohio, is the only other market still clearly in bidding-war territory at 21.9%. After those two, the drop is sharp. Atlanta at 15.0% is third, and from there every market is below the 16-metro average of 12.5%.
At the bottom of the table, six markets sit at or below 9% in Q1 2026. Five of them are in Texas or Florida (Austin, Houston, San Antonio, Tampa, Orlando, Jacksonville). In these cities, more than 91% of recent sellers took offers at or below their list price.
How Many U.S. Homes Sell Above Asking Now? The National Trend
Volume-weighted across all 16 markets and all transactions, the share of homes selling above the original list price has nearly halved in three years.
| Year | Transactions Analyzed | Sold Above List | Share Over List |
|---|---|---|---|
| 2023 | 673,256 | 144,725 | 21.5% |
| 2024 | 682,133 | 116,175 | 17.0% |
| 2025 | 686,661 | 92,057 | 13.4% |
| 2026 (Q1) | 125,158 | 14,463 | 11.6% |
Source: An analysis of aggregated MLS data, Jan. 2023 through Mar. 2026, 16 U.S. metropolitan areas.
About 1 in 9 buyers across these metros now pays above asking, down from 1 in 5 in 2023. NAR’s February 2026 report attributes the broader shift to inventory rebuilding: months of supply has climbed from a 1.7-month low to 3.5 months, the largest available supply for buyers since 2020. Redfin’s national tracking shows the same trajectory at the country level.
What the national average hides is just how concentrated the remaining bidding-war activity has become.
The Holdouts: Where Sellers Still Hold the Cards
St. Louis is the bidding-war capital of the dataset. Even after three years of national cooling, an average of 29.6% of single-family homes sold there in Q1 2026 closed above the original list price. By the time spring arrives, that share has historically climbed past 50%. In June 2023, it hit 55.3%. In June 2024, 51.1%.
The reason has more to do with what hasn’t changed in St. Louis than with what has changed elsewhere. Inventory remains tight, prices stay among the most affordable of any major metro in the dataset, and demand for well-priced homes consistently outstrips supply. When a desirable property hits the MLS in St. Louis, multiple offers are still the norm rather than a memory.
Columbus, Ohio, follows similar logic. At 21.9% in Q1 2026, Columbus is the only other market in the dataset still clearly in bidding-war territory. Its peak month of May has averaged 46.4% above list across the available years. Like St. Louis, Columbus combines affordability, steady job growth, and a housing supply that has not kept up with the buyers chasing it.
After those two, the next tier (Atlanta, Las Vegas, Charlotte, Columbia (SC)) sits between 12% and 15%. Bidding wars happen in these markets but are not the default outcome. Roughly 1 in 7 to 1 in 8 transactions closes above list, and seller leverage tends to be selective by neighborhood and condition.
Where Bidding Wars Have Effectively Ended
At the bottom of the standings, five Sun Belt metros now look like genuine buyer’s markets: Austin (7.8%), Houston (8.2%), Jacksonville (8.3%), Orlando (8.4%), and Tampa (8.4%). San Antonio (9.0%) sits just above them.
Austin is the clearest case. As recently as 2022, the metro was a poster child for the pandemic-era boom: out-of-state cash buyers, multiple-offer chaos, and rapid price growth fueled by tech relocations. Three years later, the median single-family home in Austin spends 90 days on the market, the average listing drops more than $29,000 from its initial price before closing, and just under 8% of homes sell above asking. The cycle did not just slow. It inverted.
Texas as a whole has cooled hard. Three of the four softest markets in the dataset (Austin, Houston, San Antonio) are Texan. Dallas at 10.6% is the warmest of the four. Inventory in Texas markets has rebuilt faster than in much of the country, in part because builder activity continued through 2023 and 2024 even as buyer demand softened. The result is an inventory surplus relative to the nationally tight 3.5-month supply NAR reported for early 2026.
Florida shows a similar pattern. Tampa, Orlando, and Jacksonville are all at 8.4% or below. The three Florida metros also share something with Texas: the seasonal swing in bidding-war activity is among the smallest in the dataset. Buyers and sellers in these markets do not see the spring spike that defines Midwestern and Carolina housing patterns.
Where Bidding Wars Have Cooled the Most Since 2023
Comparing each market’s Q1 2026 to its peak Q1 (either 2023 or 2024) shows where the change has been steepest. The same January-through-March window is used for every year so seasonal noise does not distort the comparison.
| Rank | Market | Peak Q1 % Over List | Q1 2026 % Over List | Decline (pp) |
|---|---|---|---|---|
| 1 | Raleigh | 22.1% (2024) | 11.7% | -10.4 |
| 2 | Charlotte | 22.2% (2024) | 12.8% | -9.4 |
| 3 | Columbus, OH | 30.4% (2024) | 21.9% | -8.5 |
| 4 | Columbia, SC | 20.3% (2023) | 12.3% | -8.1 |
| 5 | Atlanta | 22.6% (2024) | 15.0% | -7.6 |
| 6 | Dallas | 16.0% (2024) | 10.6% | -5.4 |
| 7 | Las Vegas | 19.3% (2024) | 14.0% | -5.3 |
| 8 | St. Louis | 34.2% (2024) | 29.6% | -4.6 |
| 9 | Indianapolis | 14.5% (2023) | 10.5% | -4.0 |
| 10 | Houston | 11.7% (2023) | 8.2% | -3.5 |
| 11 | Jacksonville | 11.3% (2024) | 8.3% | -3.0 |
| 12 | Austin | 10.5% (2024) | 7.8% | -2.7 |
| 13 | Phoenix | 14.6% (2024) | 11.9% | -2.7 |
| 14 | San Antonio | 11.5% (2023) | 9.0% | -2.5 |
| 15 | Orlando | 10.8% (2023) | 8.4% | -2.4 |
| 16 | Tampa | 10.8% (2023) | 8.4% | -2.4 |
Source: An analysis of aggregated MLS data, Q1 of each year 2023 through 2026.
The Carolinas saw the biggest moves. Raleigh and Charlotte each gave up roughly 10 percentage points from their 2024 peaks. Both metros became national stories during the pandemic for explosive in-migration and rapid price growth. Both have decisively cooled, with above-list shares now closer to Tampa than to St. Louis. Columbus, Columbia, and Atlanta each fell by 7 percentage points or more.
The pattern: the bigger the boom, the bigger the cooldown. Markets that surged the hardest during 2021 and 2022 have given up the most ground. Markets that never crossed 12% to begin with had less room to fall.
Two markets stand against the trend when measured against 2023 specifically. Phoenix’s Q1 above-list share is up 1.9 percentage points from 2023 (10.0% to 11.9%), and Las Vegas is up 3.6 points (10.4% to 14.0%). Both peaked in 2024 rather than 2023, partly because their late-2022 rate-shock cooling pulled their 2023 baseline down. Both have now softened from their 2024 peaks but still run ahead of where they sat three years ago.
When Do Most Homes Sell Above Asking? The Seasonal Pattern
Bidding wars are not evenly distributed across the calendar year. Across all 16 metros averaged together, May and June run roughly twice as hot as December and January.
| Month | 16-Metro Avg. % Over List |
|---|---|
| January | 12.4% |
| February | 14.8% |
| March | 17.7% |
| April | 21.8% |
| May | 23.6% |
| June | 23.5% |
| July | 21.9% |
| August | 19.3% |
| September | 17.4% |
| October | 16.3% |
| November | 15.1% |
| December | 13.3% |
Source: An analysis of aggregated MLS data, all available months Jan. 2023 through Mar. 2026, 16 U.S. metropolitan areas.
May is the seasonal peak at 23.6%. January is the trough at 12.4%. The 11.2-point gap between peak and trough is larger than the entire 2023-to-2026 national decline (9.9 points), which means timing within a calendar year can swing a market’s bidding-war intensity more than three years of national cooling did.
The Q1 2026 standings above are therefore conservative readings of where each market will sit later in 2026. A market reading 14% in January may run at 28% by May, even after years of cooling.
Seasonal Swing by Market
The size of the swing varies dramatically. In Columbus, the share of homes selling above list moves by 26 percentage points between January and May. In Tampa, it moves by 4.5.
| Rank | Market | Seasonal Swing (pp) | Peak Month | Trough Month |
|---|---|---|---|---|
| 1 | Columbus, OH | 26.0 pp | May (46.4%) | Jan. (20.4%) |
| 2 | St. Louis | 24.9 pp | Jun. (50.3%) | Jan. (25.5%) |
| 3 | Indianapolis | 16.2 pp | May (26.5%) | Jan. (10.3%) |
| 4 | Raleigh | 15.7 pp | Jun. (30.3%) | Jan. (14.7%) |
| 5 | Atlanta | 15.0 pp | May (29.6%) | Jan. (14.6%) |
| 6 | Charlotte | 13.6 pp | May (28.3%) | Jan. (14.8%) |
| 7 | Dallas | 12.3 pp | May (22.3%) | Jan. (10.0%) |
| 8 | Las Vegas | 9.7 pp | Jun. (22.6%) | Jan. (12.9%) |
| 9 | Columbia, SC | 9.3 pp | May (23.7%) | Jan. (14.4%) |
| 10 | Houston | 7.9 pp | May (16.5%) | Jan. (8.5%) |
| 11 | Austin | 7.8 pp | Apr. (14.7%) | Jan. (6.8%) |
| 12 | Phoenix | 6.5 pp | Jun. (17.2%) | Jan. (10.7%) |
| 13 | Jacksonville | 5.8 pp | Jun. (14.2%) | Jan. (8.4%) |
| 14 | San Antonio | 5.0 pp | Jun. (13.2%) | Dec. (8.3%) |
| 15 | Orlando | 4.5 pp | Jun. (13.2%) | Jan. (8.7%) |
| 16 | Tampa | 4.5 pp | Jun. (13.3%) | Jan. (8.8%) |
Source: An analysis of aggregated MLS data, Jan. 2023 through Mar. 2026, monthly averages across all available years per market.
Markets with cold winters and clear spring thaws (Columbus, St. Louis, Indianapolis, Raleigh, Atlanta, Charlotte) see the biggest swings. Sun Belt markets with steady year-round migration see the smallest. The four Florida metros and San Antonio all stay within a 6-point band across the entire year.
For sellers, this means the timing decision matters more in some markets than in others. In Columbus, listing in May vs. November is the difference between a 46% above-list market and a 21% one. In Tampa, the same calendar choice moves the needle only a few points.
What Bidding Wars Predict About Days on Market and Price Drops
The share of homes selling above list price is closely tied to two other indicators of buyer competition. Across all 624 market-month observations:
- Correlation between % over list and average days on market: -0.73
- Correlation between % over list and average price drop: -0.69
Both relationships are strong and negative. When more buyers pay above asking, homes also sell faster and require smaller price reductions to close. When fewer buyers pay above asking, listings sit longer and prices drop more before deals come together.
In practical terms, the three metrics describe the same underlying market condition from different angles. A current Tampa or Austin seller seeing 80 to 90 days on market is also seeing larger-than-average price reductions and fewer-than-average above-list closings. A St. Louis or Columbus seller seeing 55 days on market is seeing the opposite.
The All-Time Hottest Months: How Concentrated the Peak Was
The 15 highest single-month above-list shares in the dataset all come from St. Louis or Columbus, all in 2023 or 2024. None occurred in 2025 or 2026.
| Market | Month | % Sold Above List |
|---|---|---|
| St. Louis | Jul. 2023 | 57.4% |
| St. Louis | Jun. 2023 | 55.3% |
| Columbus, OH | May 2023 | 54.7% |
| St. Louis | May 2023 | 54.4% |
| Columbus, OH | Jun. 2023 | 52.5% |
| Columbus, OH | Jul. 2023 | 52.0% |
| St. Louis | Aug. 2023 | 51.7% |
| St. Louis | Jun. 2024 | 51.1% |
| St. Louis | May 2024 | 50.3% |
| St. Louis | Jul. 2024 | 49.5% |
| St. Louis | Apr. 2023 | 48.7% |
| Columbus, OH | Apr. 2023 | 48.5% |
| St. Louis | Apr. 2024 | 46.8% |
| St. Louis | Sep. 2023 | 46.3% |
| Columbus, OH | May 2024 | 46.1% |
Source: An analysis of aggregated MLS data, Jan. 2023 through Mar. 2026.
In St. Louis in summer 2023, more buyers paid above list than below it for four consecutive months. The metro spent most of 2023 and 2024 with above-list shares above 40%. By Q1 2026, even St. Louis has cooled, but it is still the only market in the dataset above 22%.
What the Numbers Show for 2026
The data points to a few patterns that shape any current housing decision.
Bidding wars are now a regional phenomenon, not a national one. Outside St. Louis and Columbus, no market in the dataset crossed 16% in Q1 2026. National coverage of multiple-offer situations no longer reflects what most U.S. sellers will encounter.
Sun Belt cooling is the dominant trend. Raleigh, Charlotte, Atlanta, Dallas, Phoenix, and Tampa all gave up significant ground from peak. These are the same markets that drew waves of pandemic-era migration. Inventory has rebuilt, and so has buyer leverage (NAR).
Affordability now predicts competition. The two markets where bidding wars persist (St. Louis, Columbus) both run median home prices in the affordable Midwestern range. Buyers priced out of more expensive metros have stayed in markets where homes still feel within reach, and competition for the limited supply has held up.
Seasonality still has teeth in every market. May and June outpace January and February in all 16 metros. Even in cooled markets, the spring listing window draws meaningfully more competitive offers than the winter one.
For buyers, the cooling expands negotiating room outside the two hot markets. The shift from 21.5% selling above list in 2023 to 11.6% in Q1 2026 means a typical 2026 buyer faces meaningfully less competition than a 2023 buyer did across most of the country.
Methodology
This metro-level analysis is based on aggregated multiple listing service (MLS) data for single-family home transactions from January 2023 through March 2026 across 16 U.S. metropolitan markets: Atlanta, Austin, Charlotte, Columbia (SC), Columbus (OH), Dallas, Houston, Indianapolis, Jacksonville, Las Vegas, Orlando, Phoenix, Raleigh, St. Louis, San Antonio, and Tampa. The MLS data was sourced and prepared by the Offerpad Research Team.
“Percent over list” measures the share of monthly transactions where the final sale price exceeded the original list price. Year-over-year and Q1-to-Q1 comparisons use only January through March data to keep periods consistent. The volume-weighted national share is calculated by multiplying each market-month’s percent over list by its closed property count, then dividing total over-list transactions by total transactions.
The dataset includes more than 2.1 million individual transactions across 39 months. Coverage note: because the dataset runs January 2023 through March 2026, January, February, and March are represented by four years of data while April through December are represented by three. This creates a slight recency bias on absolute monthly values but does not change the relative ranking of months or markets.
Supporting national context is drawn from the National Association of Realtors’ monthly Existing-Home Sales reports (nar.realtor), Redfin’s housing market data center (redfin.com), and Realtor.com’s market trends research (realtor.com/research). Information is deemed reliable but not guaranteed.